— 10 MIN
Fixed Income Risk Analytics Software: 9 Capabilities to Evaluate
A practical buyer's guide to evaluating fixed income risk analytics software, including duration, DV01, yield-curve risk, credit spreads, scenarios, data coverage, and reporting.
Genesis Risk Monitor publishes this blog and develops one of the products discussed. Comparisons reflect the publisher's perspective. Confirm current features and pricing directly with each provider. Editorial policy
Fixed income portfolios need more than a price chart and a yield figure.
A bond’s value can change because of interest rates, the shape of the yield curve, credit spreads, liquidity, embedded options, or changes in expected cash flows. Software that treats every bond as if it were an equity ticker may miss the risk structure that matters most.
That makes the software-selection question more specific:
Does the platform understand how fixed income instruments behave, or does it simply place them inside a generic portfolio report?
This guide focuses on the capabilities advisors, analysts, and investment teams should evaluate when considering fixed income risk analytics software.
For a detailed explanation of the underlying measures, read Fixed Income Risk Analytics: Duration, DV01, and Bond Portfolio Risk Management.
1. Instrument and Data Coverage
The first question is not how many charts the software provides. It is whether the platform can correctly identify and model the instruments in the portfolio.
Coverage may need to include:
- Government bonds
- Corporate bonds
- Municipal bonds
- Floating-rate notes
- Inflation-linked bonds
- Mortgage-backed securities
- Callable or putable bonds
- Bond funds and ETFs
- Cash and money-market instruments
- International debt
- Multiple currencies
Instrument identifiers and reference data are critical. Incorrect maturity dates, coupon schedules, call features, currency, or price sources can make every downstream calculation unreliable.
Ask the provider:
- Which identifiers are supported?
- How are prices and yields sourced?
- How are missing prices handled?
- Does the system distinguish clean and dirty prices?
- Are accrued interest and cash flows modeled?
- How frequently is data updated?
- Can users inspect and correct instrument mappings?
A polished interface cannot compensate for incorrect bond data.
2. Duration, DV01, and Convexity
A fixed income platform should explain how sensitive the portfolio is to changes in interest rates.
Core measures commonly include:
Modified Duration
Modified duration estimates the percentage price change associated with a change in yield, using a first-order approximation.
DV01
DV01 translates rate sensitivity into a monetary value: the approximate change in portfolio value for a one-basis-point movement in yield.
Convexity
Convexity captures the curvature in the price-yield relationship that duration alone does not describe.
The platform should make the methodology clear. Users should be able to understand whether these measures are calculated from security cash flows, supplied by a data provider, or approximated from historical prices.
For portfolios with embedded options, simple duration may be insufficient. Effective duration or full repricing may be required.
3. Yield-Curve and Key-Rate Risk
One portfolio-duration number assumes a simplified rate movement. Actual yield curves can steepen, flatten, twist, or move differently across maturities.
Key-rate duration helps measure sensitivity at selected points on the curve, such as:
- 2 years
- 5 years
- 10 years
- 20 years
- 30 years
A useful platform should allow the user to see whether portfolio risk is concentrated in one maturity segment.
This matters because two portfolios can have similar aggregate duration while responding differently to a non-parallel curve movement.
Evaluate whether the software supports:
- Parallel shifts
- Steepening and flattening
- Custom tenor shocks
- Multiple yield curves
- Currency-specific curves
- Historical curve scenarios
- Visual key-rate exposure
4. Credit-Spread Analytics
Interest-rate risk is only one component of bond risk.
Corporate, municipal, sovereign, and structured credit can lose value when credit spreads widen even if government yields remain unchanged.
Capabilities may include:
- Spread duration
- Option-adjusted spread
- Credit-quality exposure
- Issuer concentration
- Sector concentration
- Rating migration scenarios
- Default assumptions
- Recovery assumptions
- Spread-shock scenarios
For an advisory portfolio that mainly holds bond funds, security-level spread analytics may not always be available. In that case, the system should clearly distinguish between fund-level historical risk and look-through credit exposure.
Do not assume that a low historical volatility figure means a fixed income allocation has limited credit risk.
5. Scenario Analysis and Stress Testing
Fixed income risk is often easier to understand through scenarios than through one summary statistic.
Useful scenarios may include:
- A 100-basis-point parallel rate increase
- A yield-curve steepening
- A yield-curve flattening
- Credit spreads widening
- A combined rate and credit shock
- A liquidity event
- A historical bond-market sell-off
- A currency shock for international debt
The software should show:
- Portfolio-level impact
- Contribution by holding
- Contribution by maturity
- Contribution by credit category
- Assumptions used
- Whether instruments were approximated or fully repriced
Scenario flexibility is important. A platform that offers only fixed, undocumented shocks may be less useful than one that allows users to define and review assumptions.
6. Portfolio Aggregation and Concentration
Fixed income portfolios can be diversified by number of securities while remaining concentrated by issuer, sector, maturity, rating, or currency.
The system should support portfolio views such as:
- Issuer exposure
- Parent-company exposure
- Sector exposure
- Country exposure
- Currency exposure
- Credit-rating distribution
- Maturity distribution
- Duration buckets
- Coupon structure
- Callable exposure
Advisors evaluating bond funds should also consider whether the platform provides look-through data or only treats each fund as one position.
Aggregation should work consistently across accounts and households when the portfolio review spans multiple custodial accounts.
7. Performance and Risk Attribution
A bond portfolio’s return can come from several sources:
- Coupon income
- Yield-curve movement
- Credit-spread movement
- Currency movement
- Security selection
- Roll-down
- Trading activity
Not every advisory workflow needs institutional attribution, but the software should at least separate performance from risk where possible.
A useful report should help answer:
- Did the portfolio perform well because rates fell?
- Did credit exposure drive the return?
- Did one issuer or fund dominate results?
- Did the portfolio take more duration risk than the benchmark?
- Were losses consistent with the selected strategy?
Reporting that only shows total return may hide the reason the return occurred.
8. Reporting, Export, and Methodology Transparency
Fixed income calculations can become difficult to explain if the methodology is hidden.
Evaluate whether reports include:
- Calculation dates
- Pricing dates
- Currency
- Benchmark
- Yield assumptions
- Curve source
- Confidence level and horizon for probabilistic measures
- Scenario definitions
- Data limitations
- Instrument exceptions
Advisors may also need:
- PDF export
- Editable document export
- Spreadsheet export
- Reusable templates
- Client-ready charts
- Methodology notes
- Firm disclosures
The final document should preserve the distinction between calculated facts, modeled estimates, and advisor commentary.
9. Integrations, Controls, and Operational Fit
The best analytical engine can still fail if it creates excessive manual work.
Consider:
- Holdings import
- Custodian or brokerage connections
- API access
- Portfolio-accounting integrations
- Identifier normalization
- User permissions
- Audit history
- Data validation
- Exception reporting
- Security controls
- Support for multiple portfolios and households
The platform should fit the team’s operating model.
A specialist fixed income desk may need full security-level pricing and curve analytics. An independent advisor with diversified client portfolios may place more value on allocation, concentration, historical risk, scenarios, comparison, and client communication.
Generic Portfolio Analytics vs. Specialist Fixed Income Systems
There is no universal answer to which category is best.
A Multi-Asset Portfolio Analytics Platform May Be Appropriate When:
- Fixed income is one component of a diversified client portfolio
- The advisor needs consistent portfolio-level risk measures
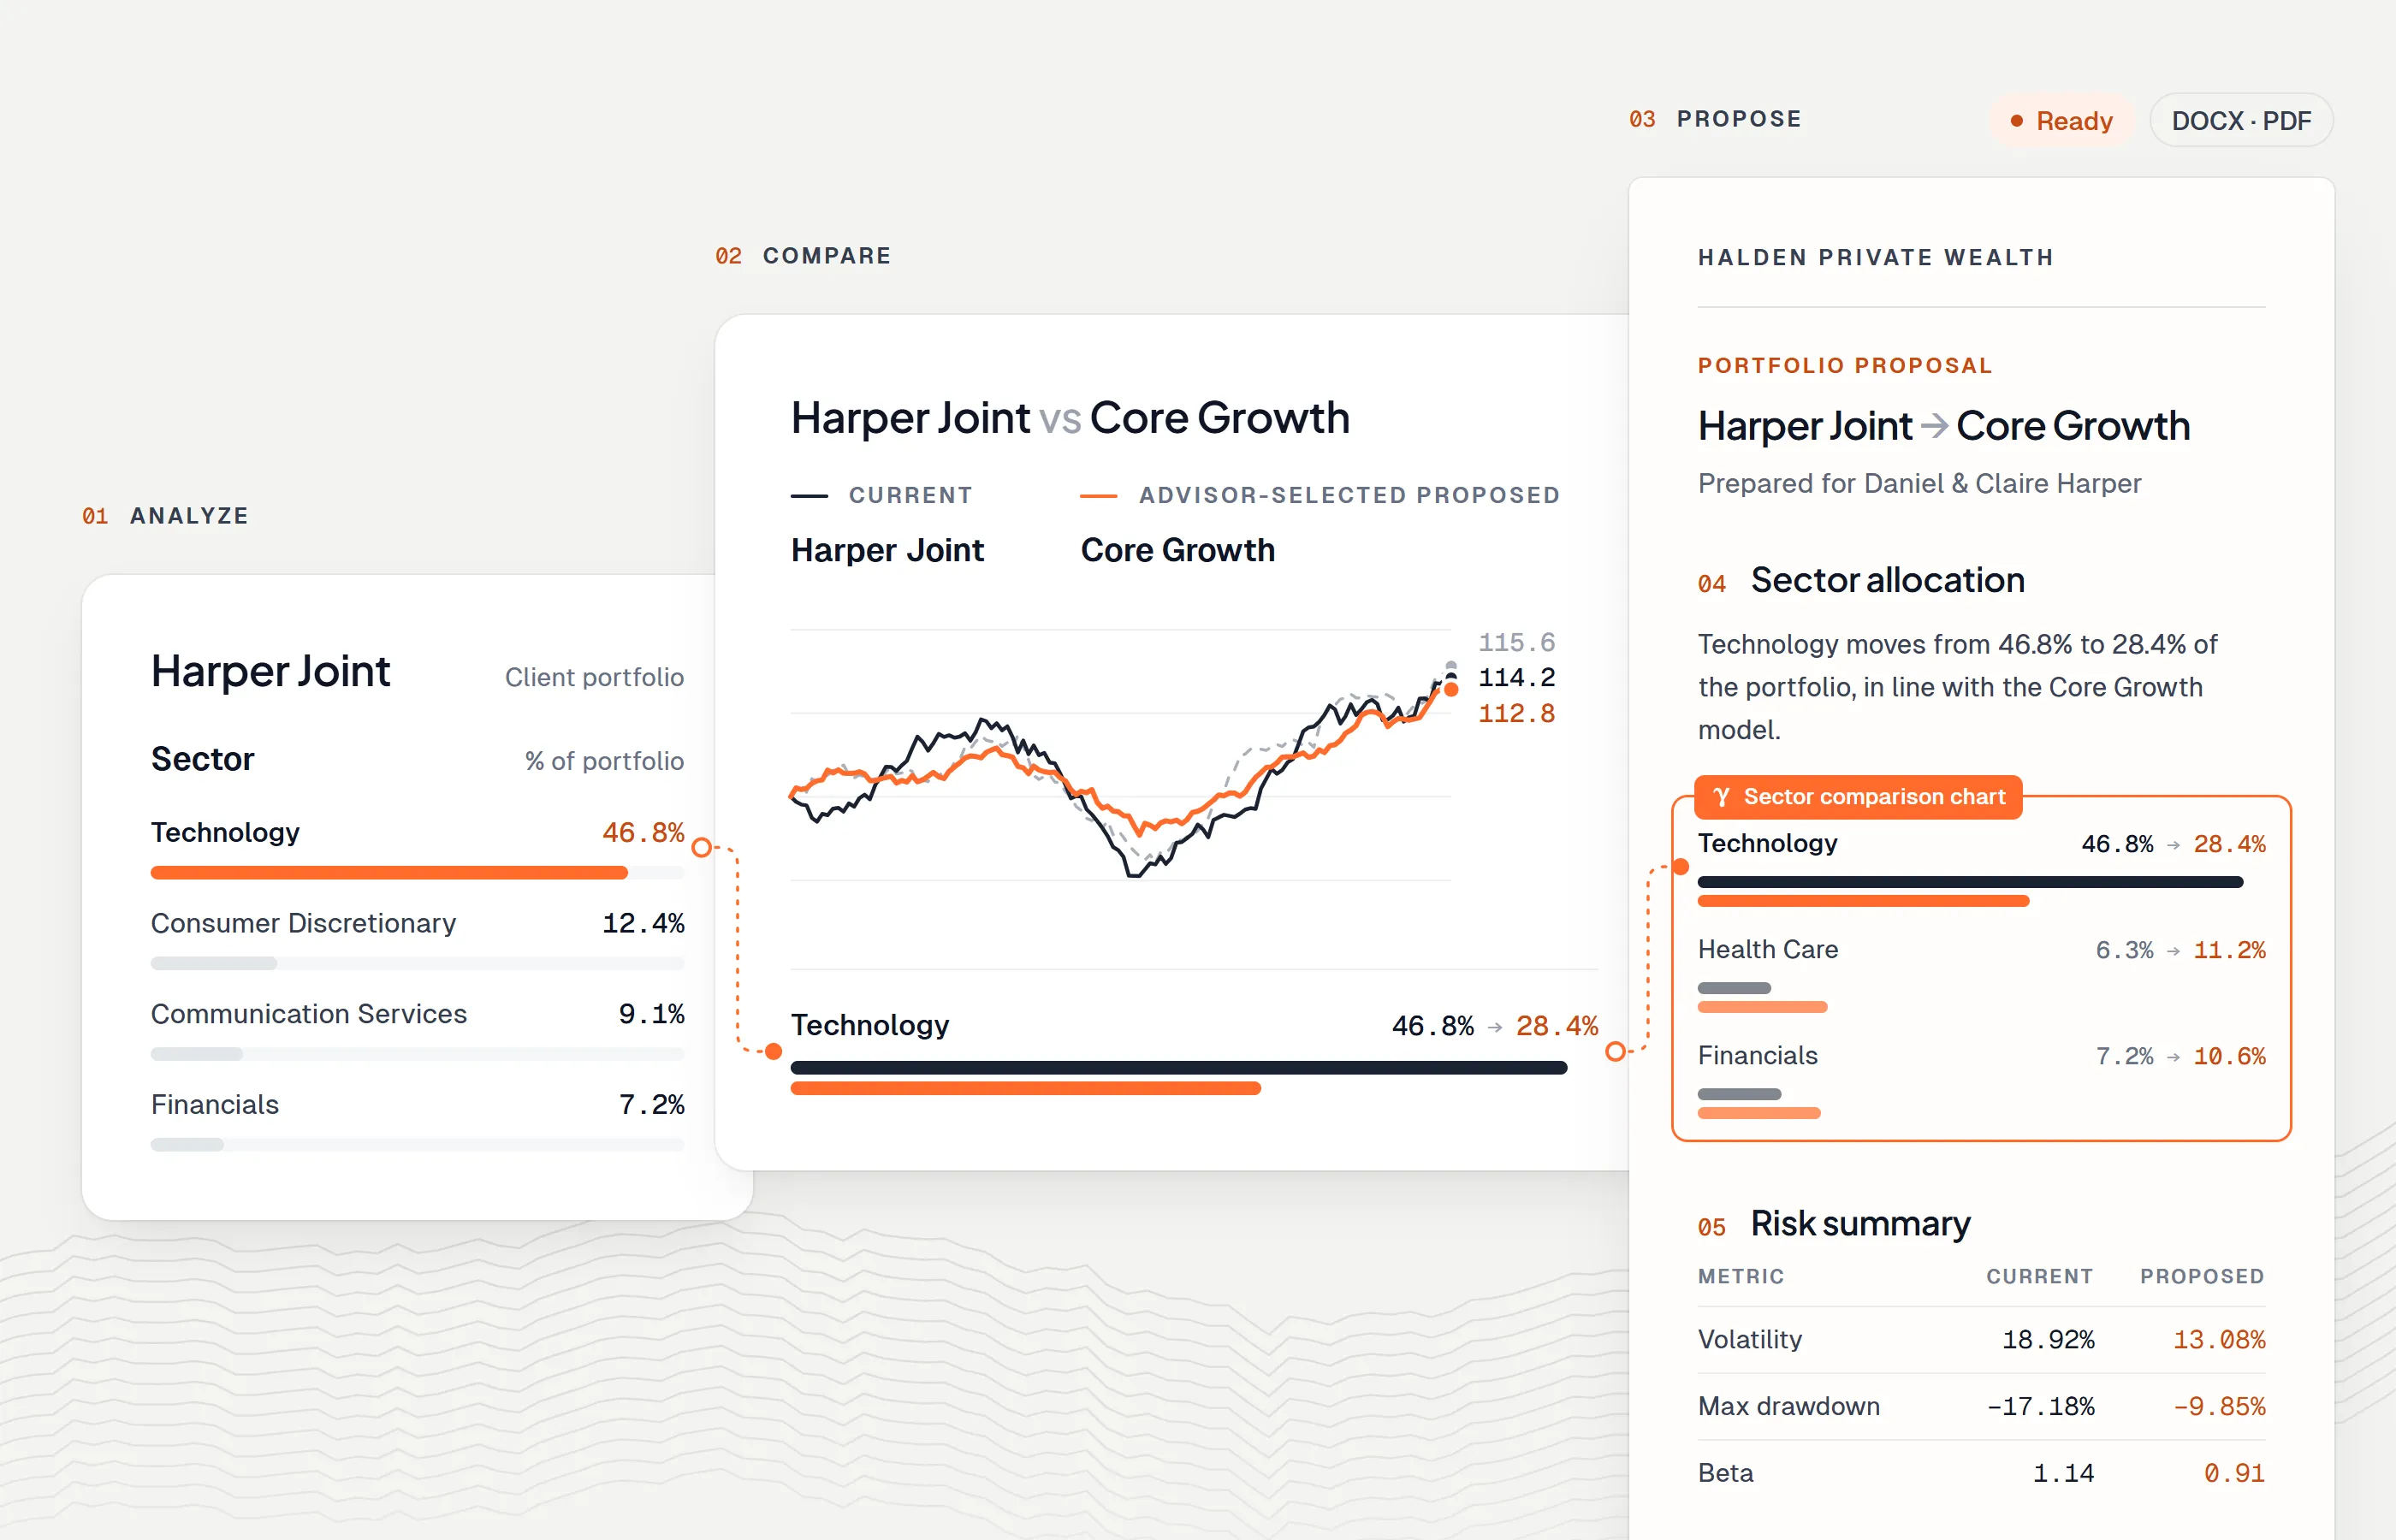
- The primary workflow is Analyze → Compare → Propose
- Client communication matters as much as security-level modeling
- Holdings are mainly liquid bonds, bond funds, and ETFs
A Specialist Fixed Income System May Be Necessary When:
- Portfolios contain complex structured products
- Security-level cash-flow modeling is essential
- The team trades duration and curve exposure actively
- Pricing depends on embedded options
- Detailed spread, default, and recovery modeling is required
- Regulatory or institutional reporting requires specialized calculations
Software selection should follow portfolio complexity, not branding.
Questions to Ask During a Demo
Use a representative portfolio and ask the provider to demonstrate:
- How instruments are identified and normalized
- How missing prices are handled
- How duration and DV01 are calculated
- How curve shocks are applied
- How credit spreads are modeled
- How bond funds are treated
- How assumptions appear in reports
- How exceptions are disclosed
- How results can be exported
- Which calculations are not supported
A transparent limitation is preferable to a calculation that appears precise but cannot be explained.
Where Genesis Risk Monitor Fits
Genesis Risk Monitor is designed around connected portfolio analysis, comparison, and proposal creation for financial advisors and investment teams.
For portfolios that include fixed income, advisors can evaluate allocation, concentration, historical behavior, portfolio-level risk, scenarios, and comparisons within the broader multi-asset workflow. The exact fit depends on the securities held and the level of bond-specific modeling required.
Specialist fixed income portfolios may require dedicated pricing, cash-flow, curve, and spread systems in addition to broader portfolio analytics.
The appropriate question is not whether one platform has every possible metric. It is whether the platform supports the portfolio, methodology, and client workflow the firm actually uses.
Final Thoughts
Fixed income risk analytics software should make bond risk more understandable, not merely add more numbers.
The most important capabilities are reliable instrument data, transparent rate and spread measures, flexible scenarios, meaningful aggregation, and reporting that explains assumptions.
Begin with the portfolio’s complexity. Then choose the analytical depth that the workflow requires.
Disclaimer: This article is for informational purposes only. Product capabilities and data coverage vary by provider and may change. Firms should verify methodology, instrument support, controls, and regulatory requirements directly before selecting software.
Frequently asked questions
What does fixed income risk analytics software do?
Fixed income risk analytics software helps users measure interest-rate sensitivity, credit-spread exposure, yield-curve risk, concentration, scenarios, and portfolio-level loss characteristics across bonds and other debt instruments.
Which fixed income risk metrics should software calculate?
Common measures include modified duration, DV01, convexity, key-rate duration, spread duration, yield, credit exposure, drawdown, stress-test impact, and appropriate portfolio-level risk measures.
Is a generic portfolio analytics platform enough for fixed income?
It depends on the portfolio. Multi-asset advisors may need allocation, concentration, performance, and scenario analysis, while specialist bond portfolios may require security-level cash-flow modeling, curve construction, spread analytics, and instrument-specific pricing.
What should advisors verify before selecting fixed income analytics software?
Advisors should verify instrument coverage, data quality, calculation methodology, scenario flexibility, benchmark support, reporting, export options, integrations, transparency, and whether the platform matches the complexity of the portfolios being analyzed.