
Load Portfolio Inputs
Bring holdings, returns, benchmarks, and macro context into the shared analytics layer.
Review portfolio risk, exposure, concentration, correlation, historical behaviour, and scenario sensitivity before the next allocation decision or client conversation.
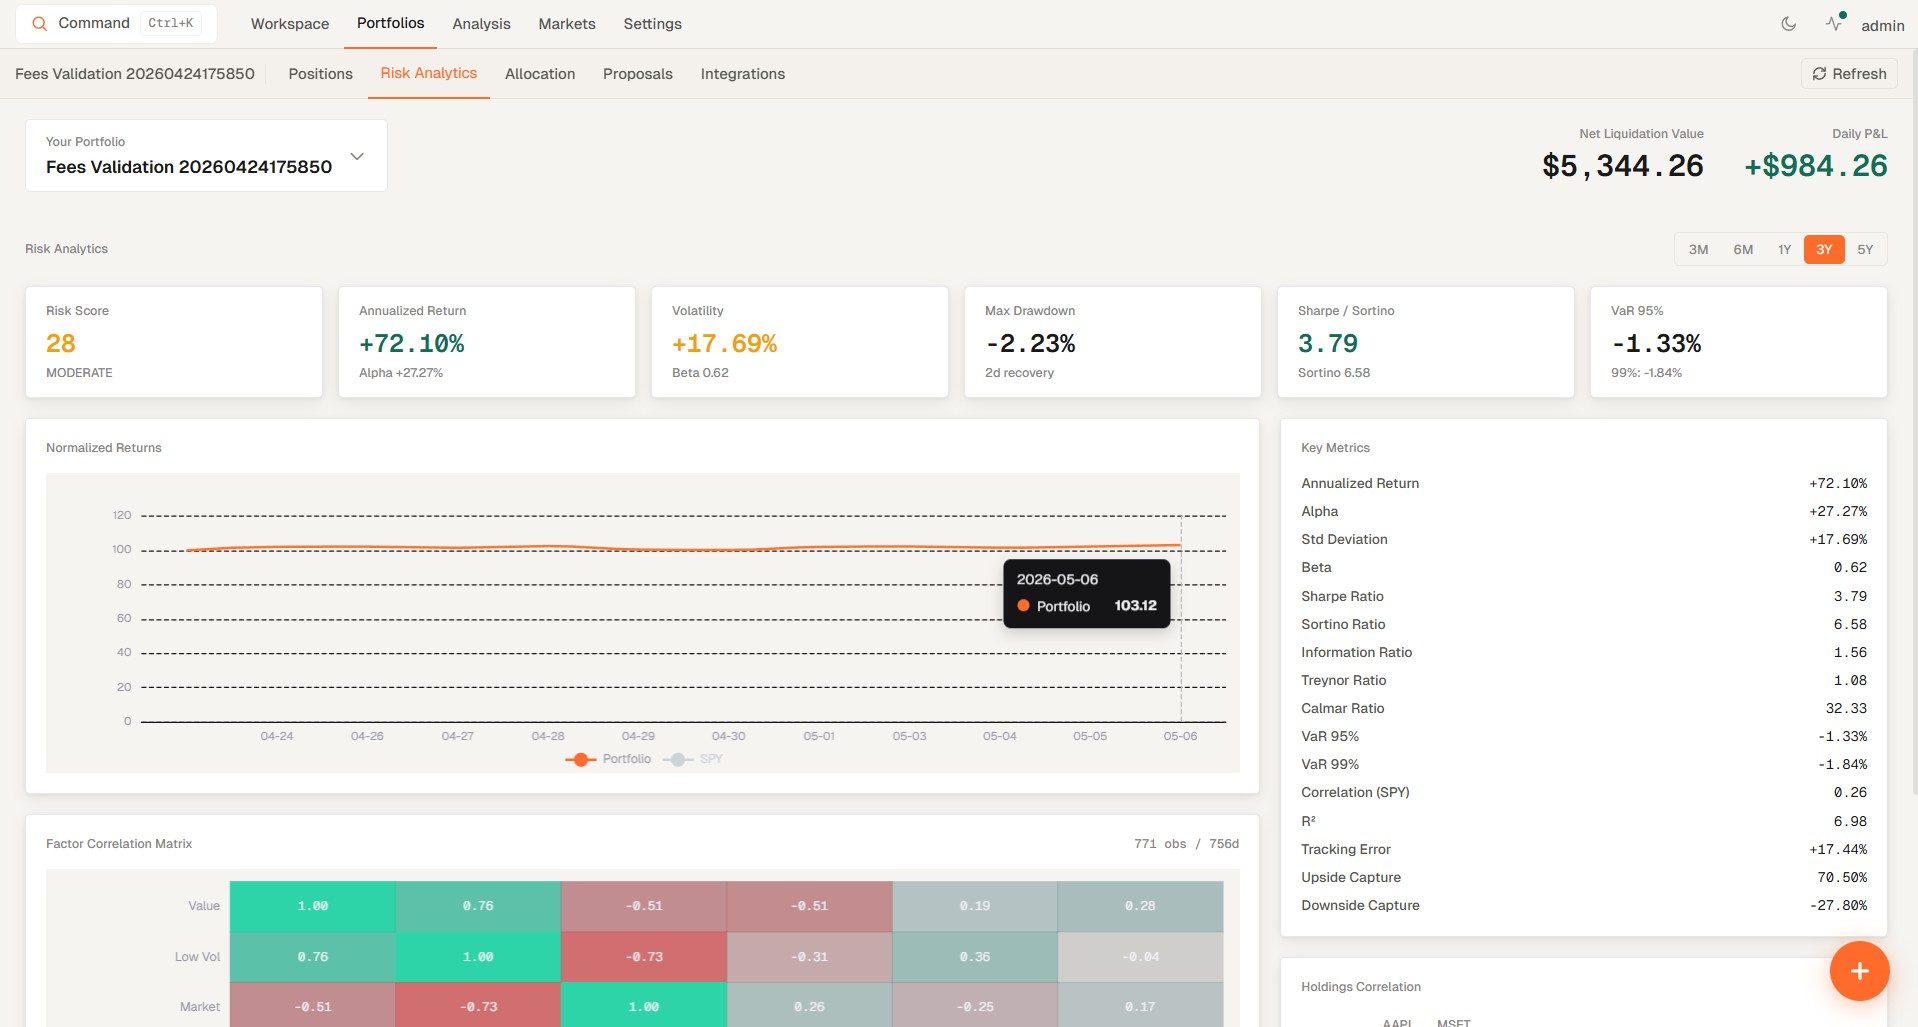
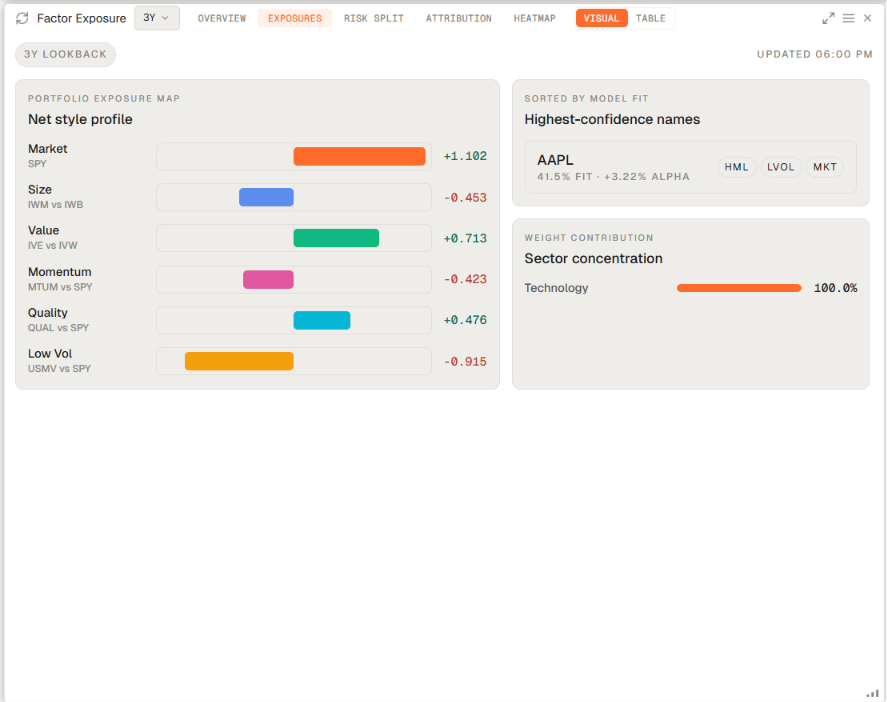
The risk analytics layer decomposes portfolio behaviour by holding, factor, and model group so analysts can identify whether market risk comes from broad beta, factor crowding, or a narrow set of names.
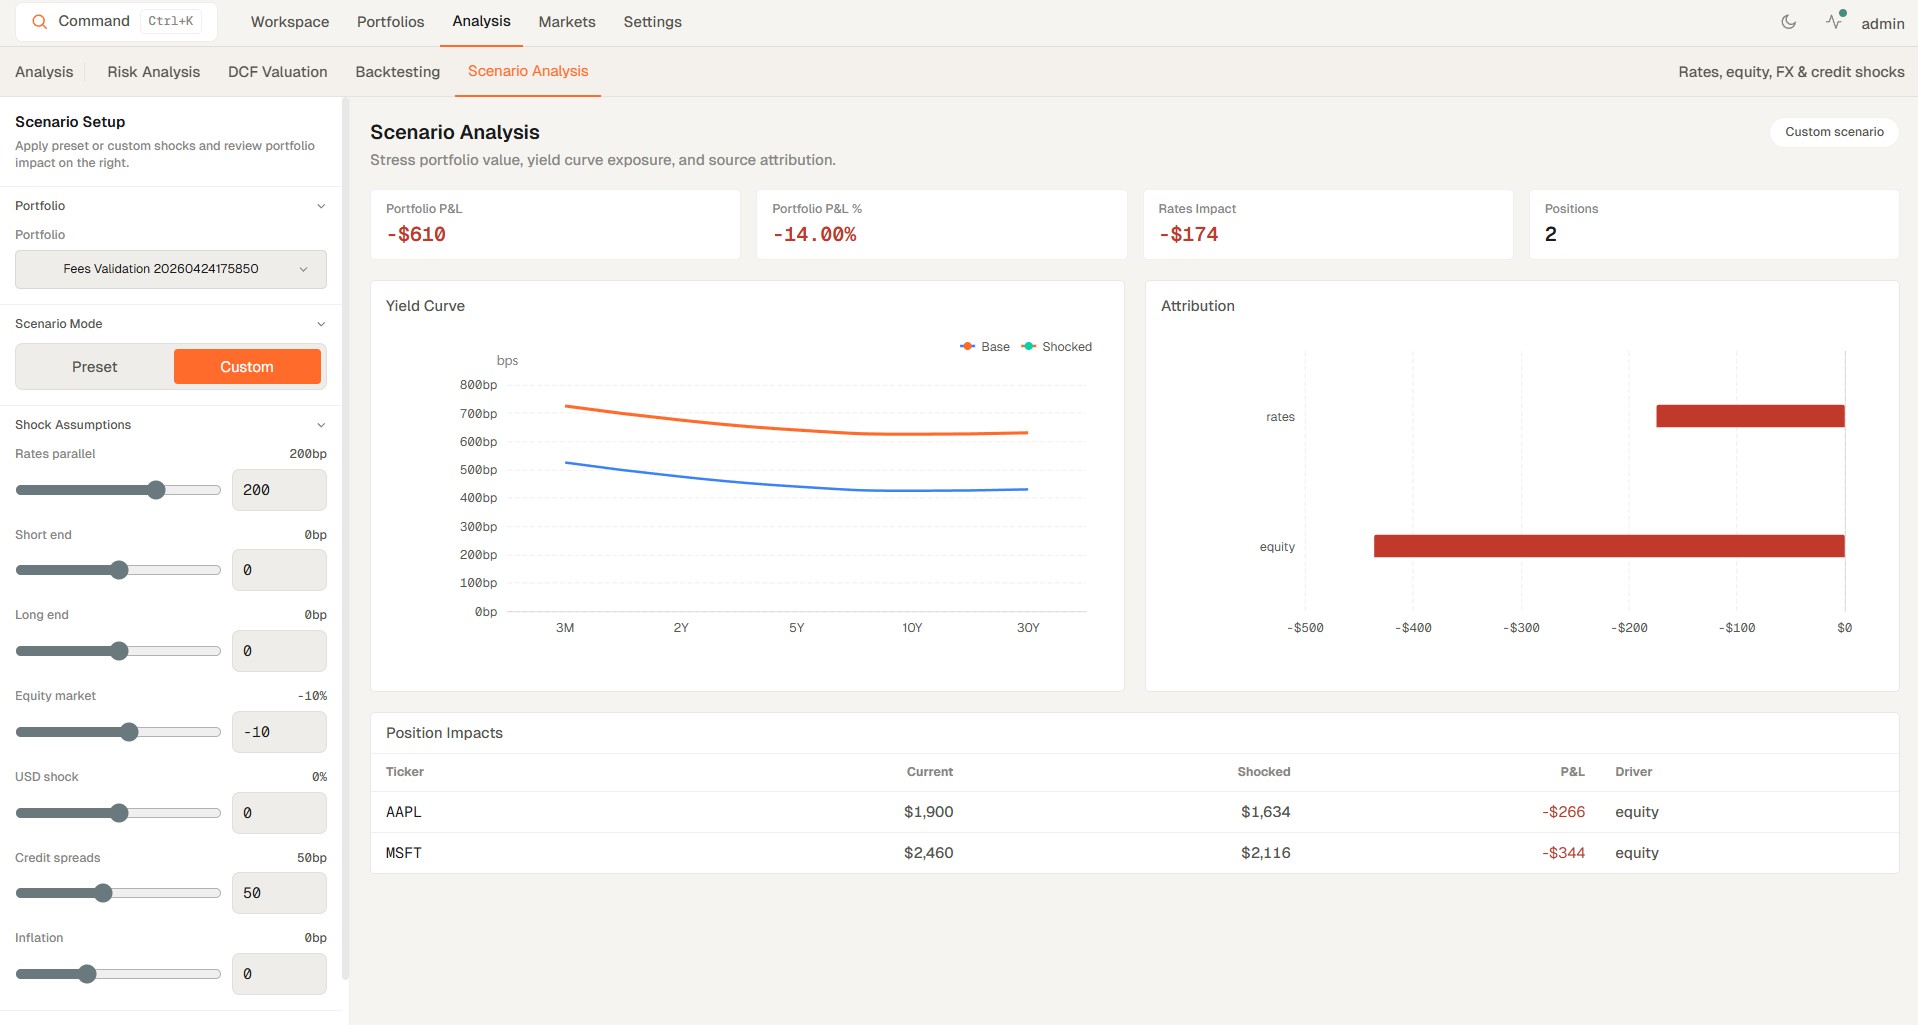
Historical replay and custom shock analysis turn abstract market-risk questions into concrete P&L, NAV, drawdown, and recovery estimates. That makes stress testing a repeatable review process instead of an ad hoc exercise.
The goal is not to produce more charts. It is to give analysts a sequence for understanding how the portfolio behaves, what drives risk, and how stress scenarios change that picture.
Bring holdings, returns, benchmarks, and macro context into the shared analytics layer.
Calculate Value at Risk, contribution to risk, concentration, and correlation coefficient behaviour.
Replay historical shocks or define custom scenarios to quantify market risk and drawdown impact.
Turn the same analytics into research notes, review-ready visuals, and operating workflows.
These are the questions teams usually ask when comparing risk analytics tools, backtesting workflows, and portfolio stress-testing platforms.
Risk analytics software helps investors and research teams measure portfolio behaviour using metrics such as Value at Risk, stress tests, correlation, concentration, and factor exposure instead of relying only on performance charts or broker summaries. See how leading portfolio risk platforms compare.
Backtesting software is used to test how a portfolio, rule set, or strategy would have behaved under historical market conditions before capital is committed or reallocated. See how historical testing fits into broader risk review.
A broker dashboard usually shows positions, balances, and basic performance, while portfolio risk software is built to explain where risk comes from, how holdings interact, and how the portfolio may behave under stress.
Yes. Genesis Risk Monitor is designed so backtesting context, portfolio measurement, and stress testing can be reviewed in one environment rather than split between spreadsheets and separate analytics tools.
Explore practical guides on portfolio risk measurement, stress testing, and backtesting workflows.
Learn what a portfolio risk analytics platform does, which capabilities matter, and how to evaluate data quality, VaR, Expected Shortfall, factor exposure, stress testing, monitoring, and reporting.
Learn how to stress test your portfolio to protect your investments from market crashes. Discover the professional methods — historical scenarios, VaR, CVaR, and model backtesting — used by risk managers daily.
Learn how to read and interpret a correlation matrix for portfolio risk management. Compare Excel, Python, R, Portfolio Visualizer, and Genesis Risk Monitor — and understand the hidden risk that correlations reveal.
Start with a workspace for portfolio analytics, stress testing, correlation review, and market risk monitoring that can be used every day, not just at month-end.