Review Equities
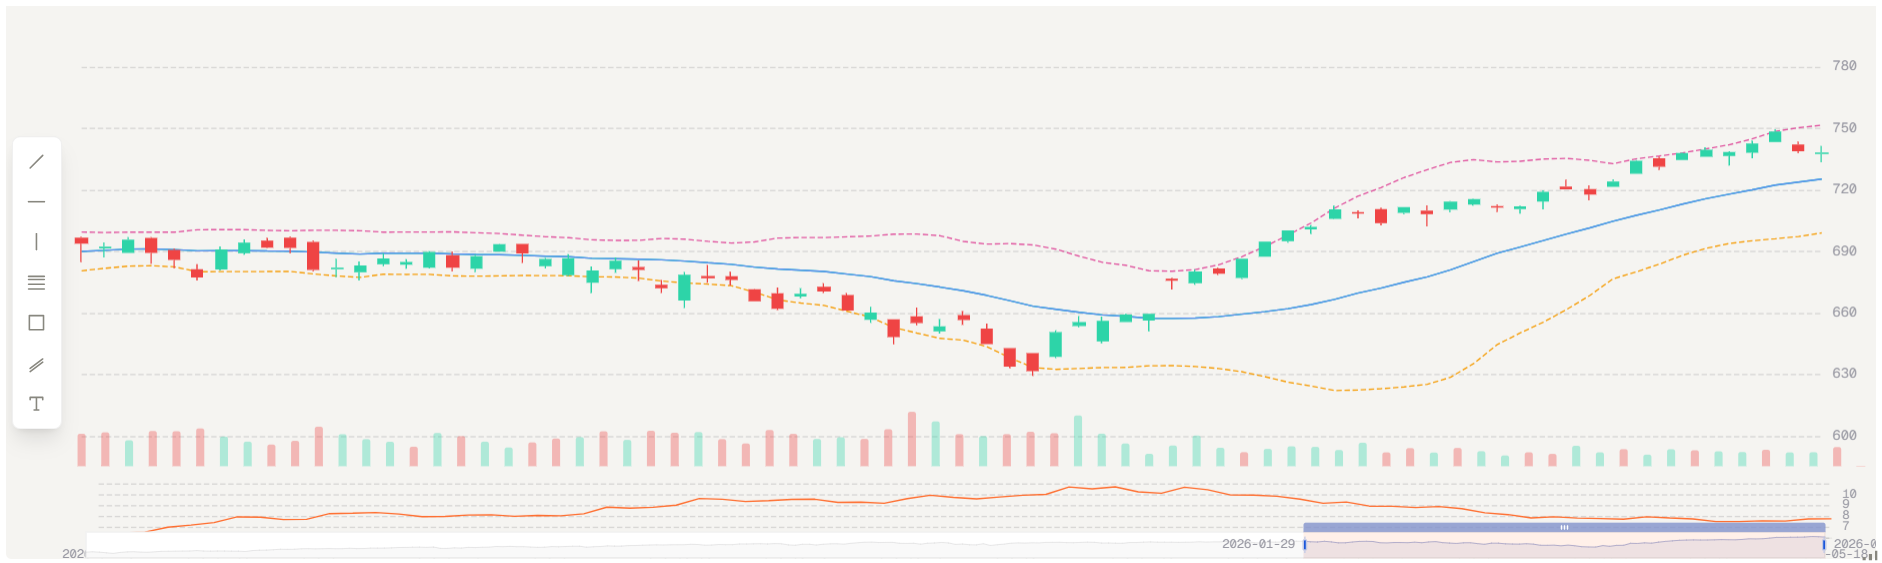
Start with single-name and sector-level equity monitoring to frame what is moving in the market.
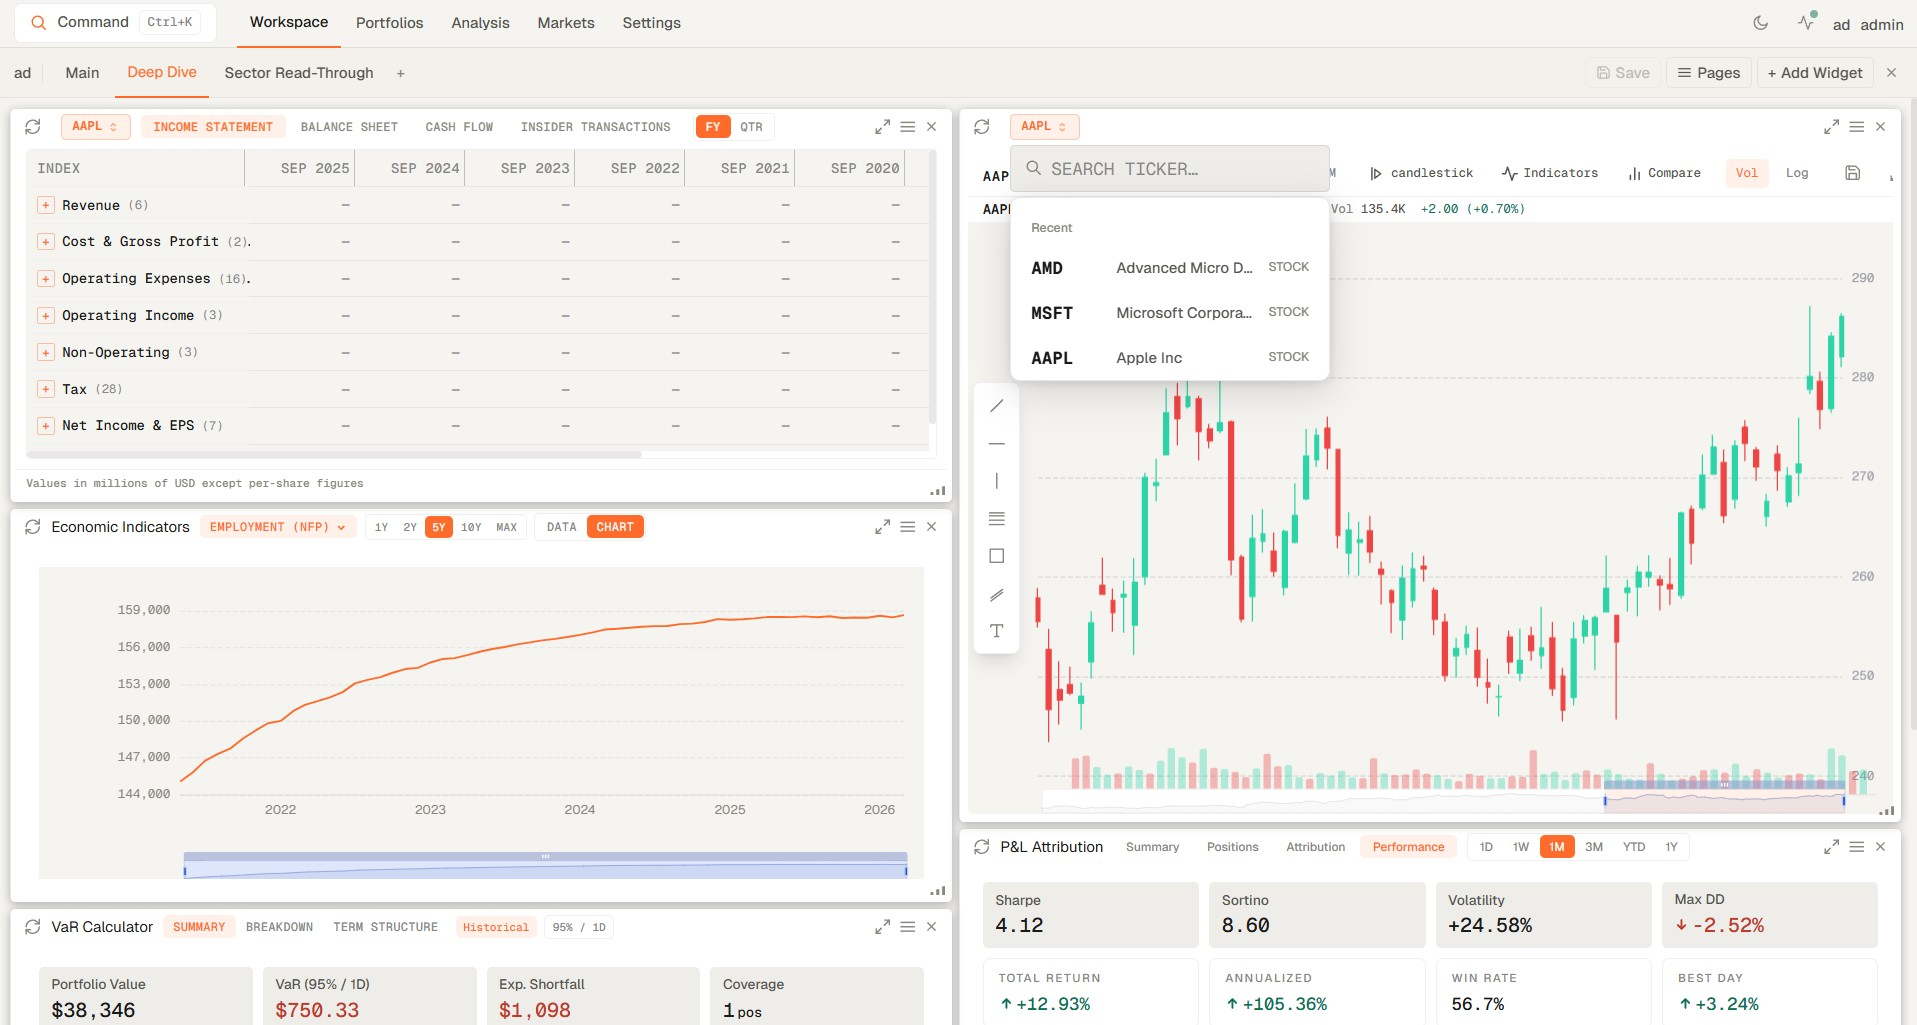
Genesis Risk Monitor gives analysts a single market data workspace for equities, ETFs and funds, FX, bonds, and commodities, with dividend and corporate-action calendars stitched in, so charting, watchlists, heatmaps, and market monitoring stay connected inside one research workflow.
The markets and data layer keeps core asset-class coverage in one place so users can move from single-name equities to ETF and fund baskets, FX pairs, bonds, and commodity markets without breaking their review workflow.
Instead of splitting charting, watchlists, and market context across disconnected tabs, Genesis Risk Monitor lets analysts assemble reusable workspaces that hold their equities, ETF and fund, FX, bond, and commodity views together.
The value is not just that the feeds exist. It is that equities, ETFs, funds, FX, bonds, and commodities can be reviewed in one sequence without breaking context between instruments, charts, and watchlists.
Start with single-name and sector-level equity monitoring to frame what is moving in the market.
Use ETFs and funds as benchmark, sector, and thematic lenses inside the same market session.
Keep major, cross, and emerging-market currency pairs visible alongside the instruments priced in them.
Track sovereign yields, treasuries, and fixed-income moves to frame the rate backdrop for every other asset class.
Keep commodity price action and cross-asset sensitivity visible while markets are moving.
Surface upcoming ex-dividend, pay-date, and earnings events for the symbols you monitor so income and reporting dates stay beside the price action.
Carry the same market view into deeper analysis, portfolio review, and reporting without rebuilding context.
These are the practical questions investors and research teams ask when they want a faster way to monitor markets, compare instruments, and keep stock charts and watchlists in one workflow.
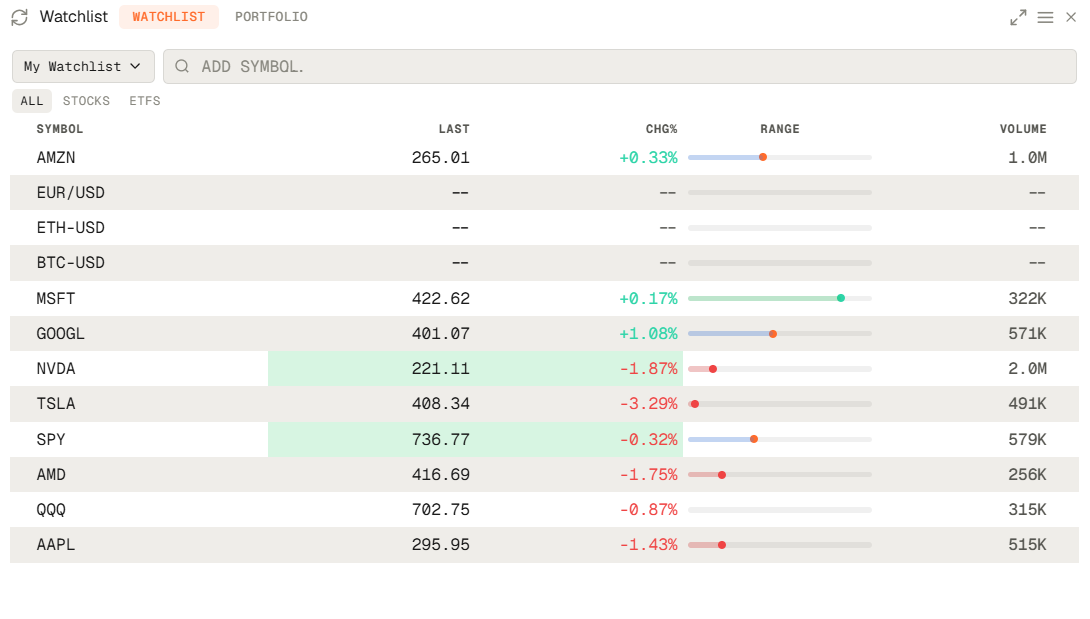
A watchlist is a saved group of securities you monitor regularly so you can track price action, relative strength, volume, and news flow without rebuilding the same screen each day. See how custom watchlist workspaces are built.
The workflow works best when watchlists surface what is moving and stock charts help you inspect trend, volatility, and context immediately, rather than sending you into a separate tool for every symbol. See how alerts extend that workflow.
Yes. Genesis Risk Monitor is designed so equities, ETFs, funds, FX, bonds, and commodities can be reviewed in one market data workspace, which is especially useful when teams want the same cross-asset view for research and portfolio monitoring.
Yes. Major, cross, and emerging-market FX pairs, sovereign yields and treasuries, and ex-dividend and pay-date calendars sit in the same market-data workspace alongside equities, ETFs, and commodities, so cross-asset review and income tracking stay in one workflow.
Yes. Brokerage integrations bring live holdings into the platform so market monitoring, watchlists, and portfolio review can happen from the same operating surface instead of separate applications. Learn how broker-connected monitoring works.
These guides deepen the exact workflow this page describes: building market workspaces, setting alerts, and connecting live portfolio context to daily monitoring.
Step-by-step guide to building custom financial dashboards in Genesis Risk Monitor. Create multi-page workspaces with 20+ drag-and-drop widgets — VaR calculators, real-time market heatmaps, macro indicators, and more.
Learn how real-time portfolio alerts — price triggers, VaR limit alerts, concentration limits, and drawdown notifications — automatically protect your capital. A complete guide to professional-grade portfolio risk monitoring.
Genesis Risk Monitor now connects directly to 20+ brokerages — including Interactive Brokers, Fidelity, Charles Schwab, Robinhood, DEGIRO, Alpaca, and Questrade — via read-only SnapTrade integration. Sync your live portfolio positions and immediately run daily VaR, Factor Exposure, P&L Attribution, and risk limit monitoring. No manual entry. No API keys. One secure OAuth connection.
Start a trial and give your team one place to monitor cross-asset pricing, stock charts, watchlists, dividend calendars, and market context without splitting the workflow across multiple tools.