— 8 MIN
Global Market Data Guide: Forex, Crypto, Equities, ETFs, Bonds, and Commodities (2026)
A complete cross-asset market data guide for 2026 covering equities, ETFs, forex (FX), crypto, bonds, commodities, and equities options — with a comparison table, risk analytics overview, and how to unify global market data in a single free platform.
The single greatest edge retail investors can build in modern markets has nothing to do with predicting the next earnings surprise or timing a macro turn.
It is data clarity — knowing exactly what is moving, why it is moving, and what that means for your specific portfolio at this moment.
The 2026 financial landscape is defined by interconnected macro forces: sticky inflation in the Eurozone, diverging central bank policy between the Fed and ECB, rapid expansion of tokenised assets, and commodity markets disrupted by energy transition dynamics. Navigating this environment across a single asset class is difficult. Navigating it across equity positions, currency exposure, fixed income, and digital assets simultaneously — without a unified data view — is borderline impossible.
This guide breaks down the seven core asset classes every modern investor needs to track, explains what each data segment tells you that the others cannot, and shows how consolidating that data into a single analytical environment changes the quality of every decision you make.
Key Takeaways
- Seven asset classes — equities, ETFs, forex (FX), crypto, bonds, commodities, and equities options — each provide distinct signals that are only fully interpretable in cross-asset context.
- Data fragmentation is not a minor inconvenience; it is a structural blind spot that causes investors to miss correlation-driven risk events.
- Real-time data plus derived analytics (VaR, Factor Exposure) transforms raw price streams into actionable risk intelligence.
- European investors face Eurozone-specific macro risks that require dedicated FX, bond, and commodity data coverage — not just US-centric equity feeds.
- Genesis Risk Monitor unifies all seven asset classes in a single free platform, with automated risk metrics and custom alerts available without a subscription.
The 2026 Cross-Asset Landscape
Markets no longer move in isolation. In 2026, a shift in Fed rate expectations triggers a USD rally that simultaneously compresses emerging market equities, pressures commodity prices denominated in dollars, and widens credit spreads in high-yield corporate bonds. A single macro event produces ripples across every asset class within hours.
For investors managing portfolios across multiple asset classes — or even just equity investors with FX exposure through internationally operating companies — the ability to monitor these linkages in real time is no longer optional. It is the baseline requirement for competent risk management.
Understanding each asset class in isolation is the prerequisite. Understanding how they interact is the analytical edge.
The Seven Asset Classes: What Each Data Stream Tells You
Equities: Corporate Performance as a Market Signal
Equities represent fractional ownership in publicly traded companies and are the traditional foundation of growth-oriented portfolios. Beyond individual stock prices, equity market data — earnings revisions, breadth indicators, sector rotation patterns — provides the most granular signal of corporate health and investor risk appetite available in any market.
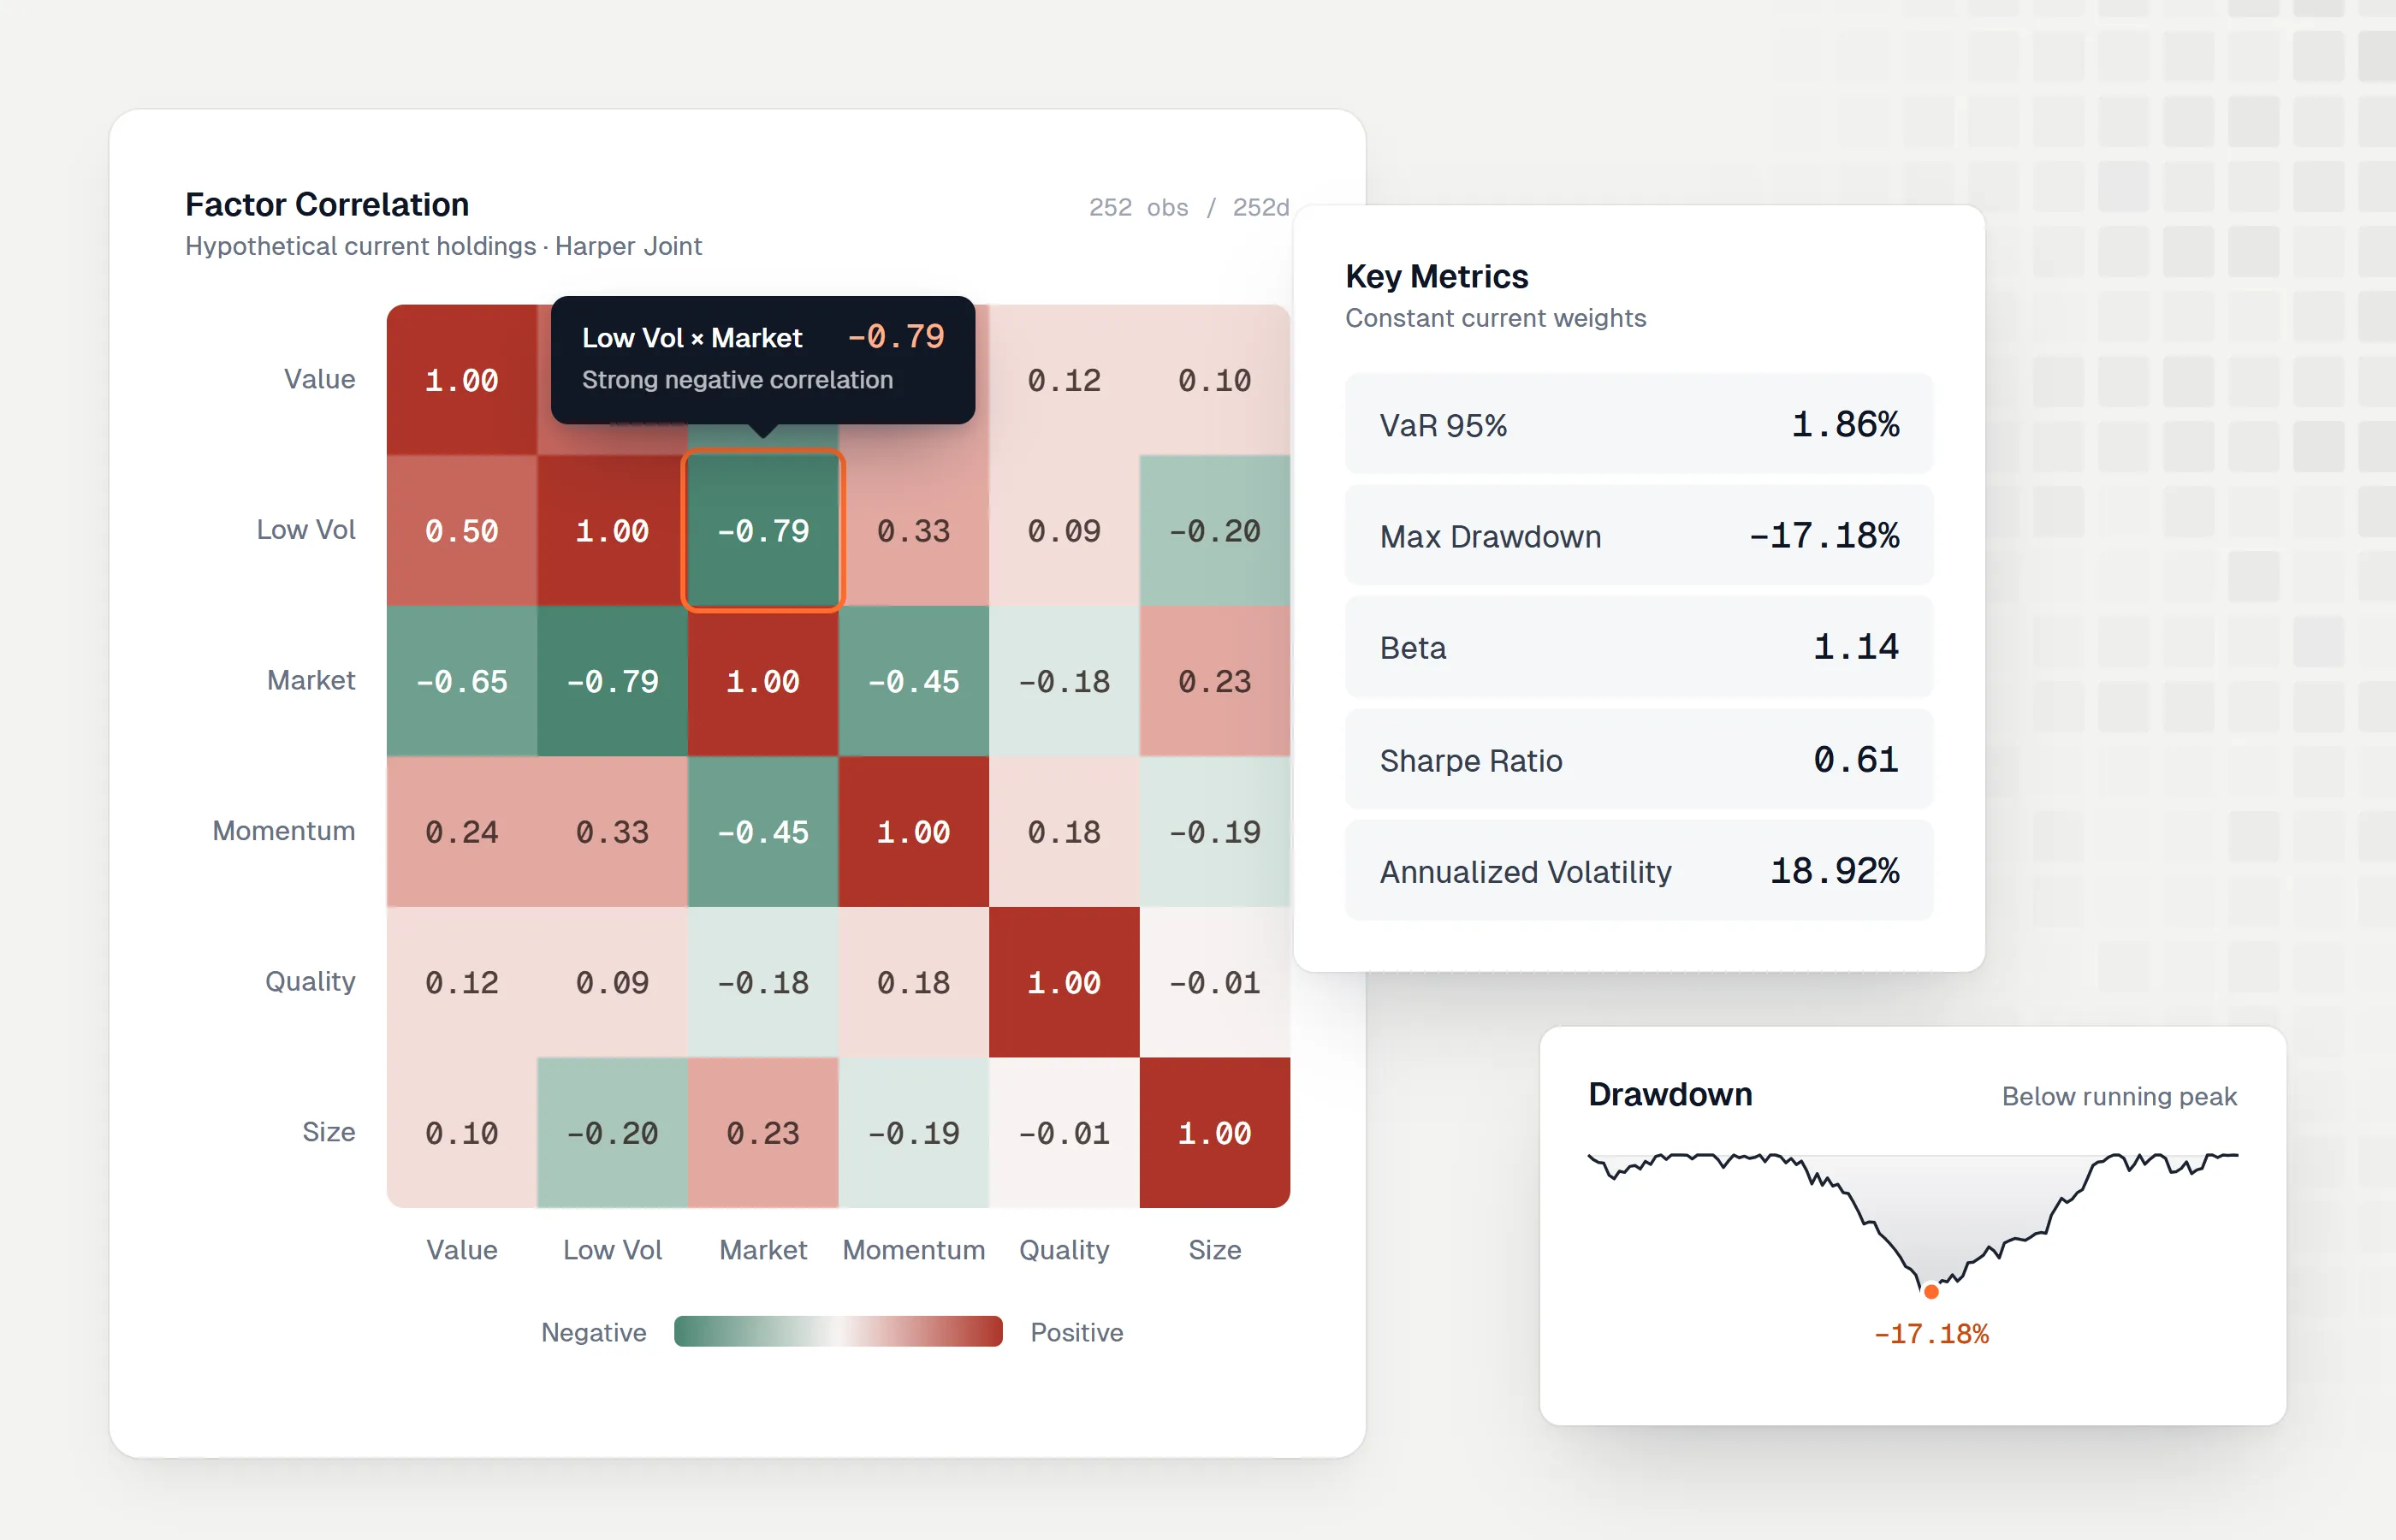
For investors using Factor Exposure analysis, equity data feeds directly into models that decompose portfolio risk across market beta, size, momentum, value, and volatility factors — revealing concentrations that sector labels alone will not surface.
ETFs: The Pulse of Collective Allocation
ETFs bundle dozens or hundreds of securities into a single tradeable ticker. Their flow data is among the most powerful macro signals available: when money rotates from equity ETFs into bond ETFs at scale, it reflects aggregate investor positioning rather than individual opinion. Tracking ETF volume alongside price movements reveals where institutional capital is actually moving, not just where strategists say it should move.
Forex (FX): The Macro Thermometer
The global foreign exchange market processes over $7 trillion in daily volume — making it the largest and most liquid financial market on Earth. FX data is indispensable even for equity-only investors: currency moves affect the reported earnings of internationally exposed companies, drive commodity price dynamics, and reflect central bank credibility in real time.
For European investors specifically, monitoring EUR/USD, EUR/GBP, and EUR/CHF pairs provides a live feed of Eurozone macro stress that often leads equity and bond markets by hours or days.
Crypto: Digital Economy Signal and Volatility Benchmark
Digital assets — Bitcoin, Ethereum, and the broader DeFi ecosystem — operate on 24/7 markets with no central clearing counterparty. While inherently volatile, crypto market data offers two distinct analytical inputs: a sentiment signal for risk appetite at the speculative frontier of capital markets, and a window into the tokenised asset economy that is progressively integrating with traditional finance. Tracking crypto is no longer optional for investors seeking a complete picture of how capital moves globally.
Bonds: The Risk-Free Rate and Credit Spreads
Government bond yields set the baseline cost of capital against which all other assets are valued. When 10-year Bund yields rise, equity valuations compress mechanically via the discount rate in DCF models. Corporate bond spreads — the premium over government yields demanded by lenders to corporate borrowers — are among the most reliable leading indicators of credit stress and equity market volatility.
For fixed income context, see our detailed guide on fixed income risk analytics.
Commodities: Supply Chain Reality vs. Financial Speculation
Commodities — crude oil, natural gas, gold, copper, agricultural products — bridge the physical economy and financial markets. Oil price data signals energy inflation. Gold functions as a real-asset hedge against both inflation and currency debasement. Copper tracks industrial demand. No multi-asset portfolio is properly risk-managed without commodity price awareness, even if direct commodity exposure is zero: the second-order effects on corporate earnings, central bank policy, and bond yields are pervasive.
Equities Options: What the Market Implies About the Future
Options markets are the only asset class where the price itself encodes a probability distribution. Implied volatility — the vol priced into options contracts — tells you what the market believes the range of future price outcomes will be. VIX, VSTOXX, and individual name implied vol are the most valuable data inputs for timing portfolio hedges and understanding whether market participants are complacent or defensive at any given moment.
Cross-Asset Data Comparison: What Each Market Tells You
| Asset Class | Primary Signal | Liquidity | Volatility | Best Used For |
|---|---|---|---|---|
| Equities | Corporate health, earnings growth | High (large-caps) | Medium | Growth, alpha generation |
| ETFs | Collective allocation, capital flows | Very High | Low–Medium | Diversification, sector rotation |
| Forex (FX) | Macro divergence, central bank policy | Very High | Low–Medium | Currency risk, macro context |
| Crypto | Risk appetite, digital economy | High (major pairs) | Very High | Speculative exposure, DeFi monitoring |
| Bonds | Cost of capital, credit stress | Medium–High | Low | Capital preservation, rate risk hedging |
| Commodities | Supply chains, inflation, geopolitics | Medium–High | Medium–High | Inflation hedging, macro exposure |
| Equities Options | Implied volatility, probability distributions | Medium | High | Portfolio hedging, yield enhancement |
Why Data Fragmentation Is the Hidden Risk
Most retail investors use three to five separate platforms to cover these seven asset classes. A brokerage app for equities. A separate terminal for FX. A crypto exchange interface for digital assets. A free bond screener for rates.
The problem is not the cost or the inconvenience. The problem is the gaps between platforms — and those gaps are precisely where risk events live.
Cross-asset correlation spikes during market stress. When credit spreads widen rapidly, equity volatility follows within hours. When FX volatility rises sharply in a currency pair tied to commodity imports, commodity prices reprice almost simultaneously. An investor monitoring equities in isolation will see the equity move, but miss the two signals that predicted it — and miss the hedging window that those signals would have opened.
Unified market data is not a convenience feature. It is a structural advantage.
What Unified Market Data Actually Enables
When all seven asset classes are visible in a single environment, the analytical capability changes qualitatively, not just quantitatively:
- Cross-asset correlation monitoring becomes possible in real time, not retrospectively.
- Risk limit alerts can be set against multi-asset portfolio conditions — not just individual price thresholds.
- VaR calculations can incorporate the full covariance structure across equity, FX, and commodity positions simultaneously.
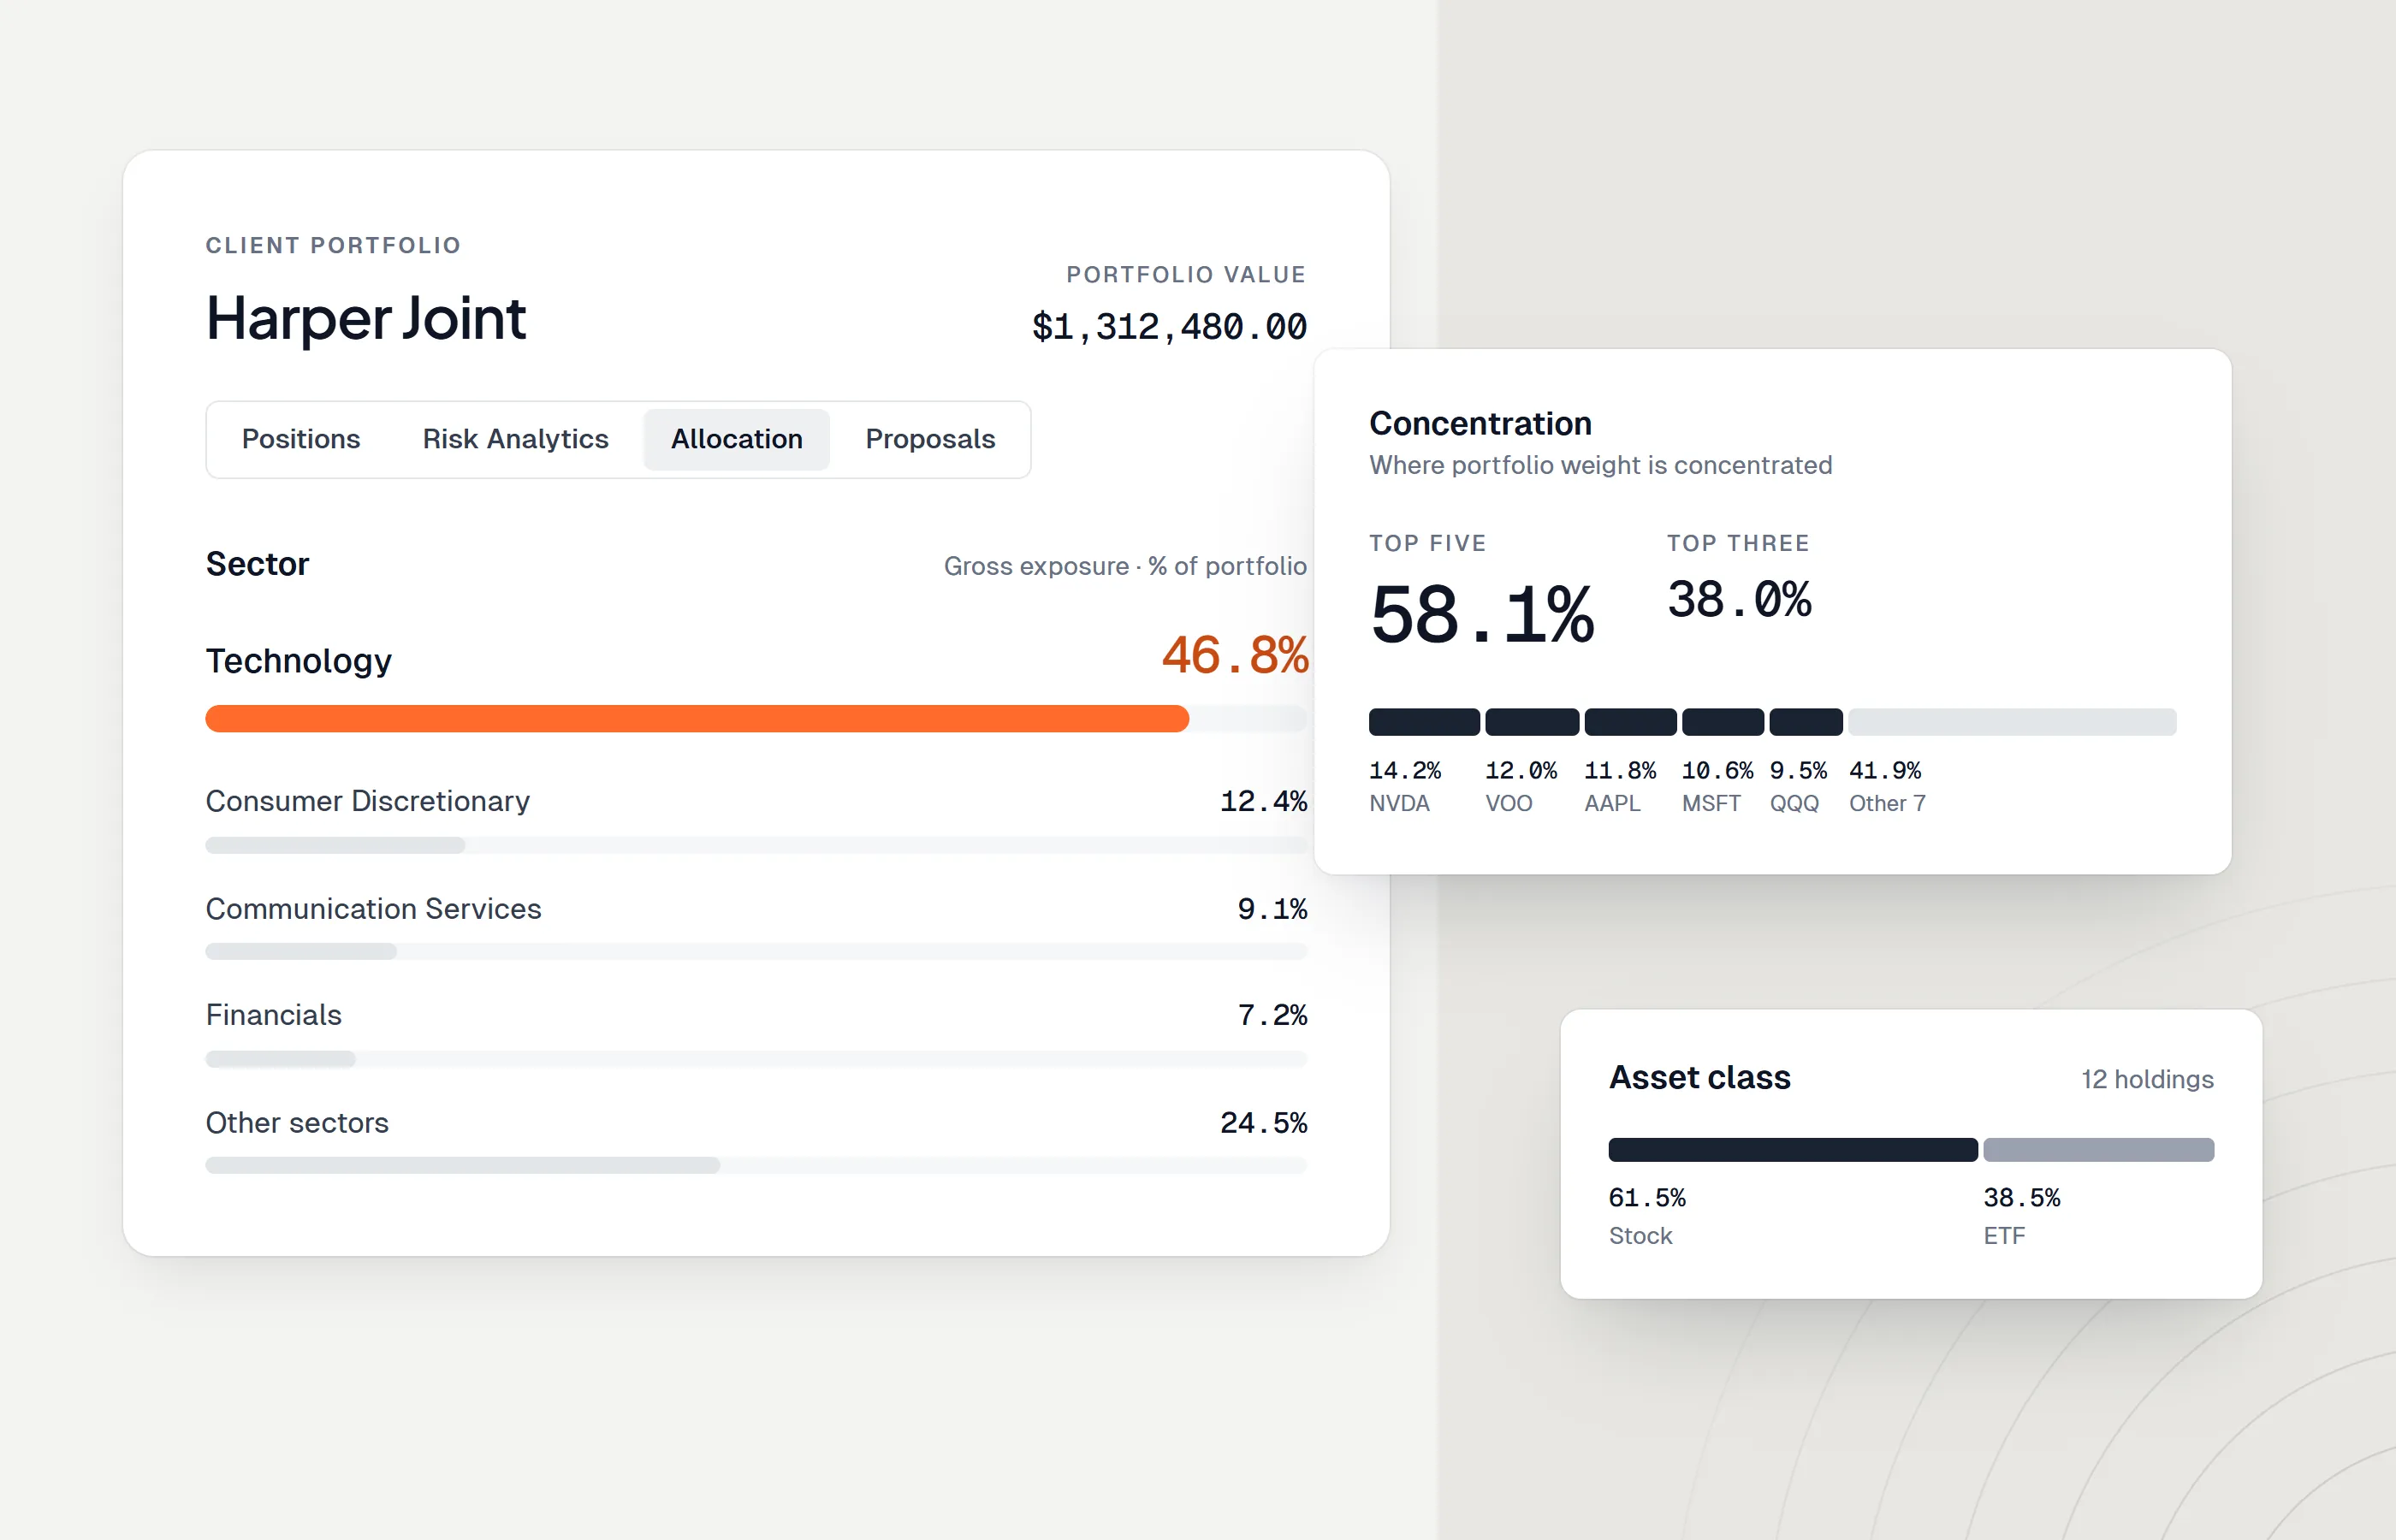
- Factor Exposure analysis can detect whether apparent diversification across equities is undermined by shared macro factor loading.
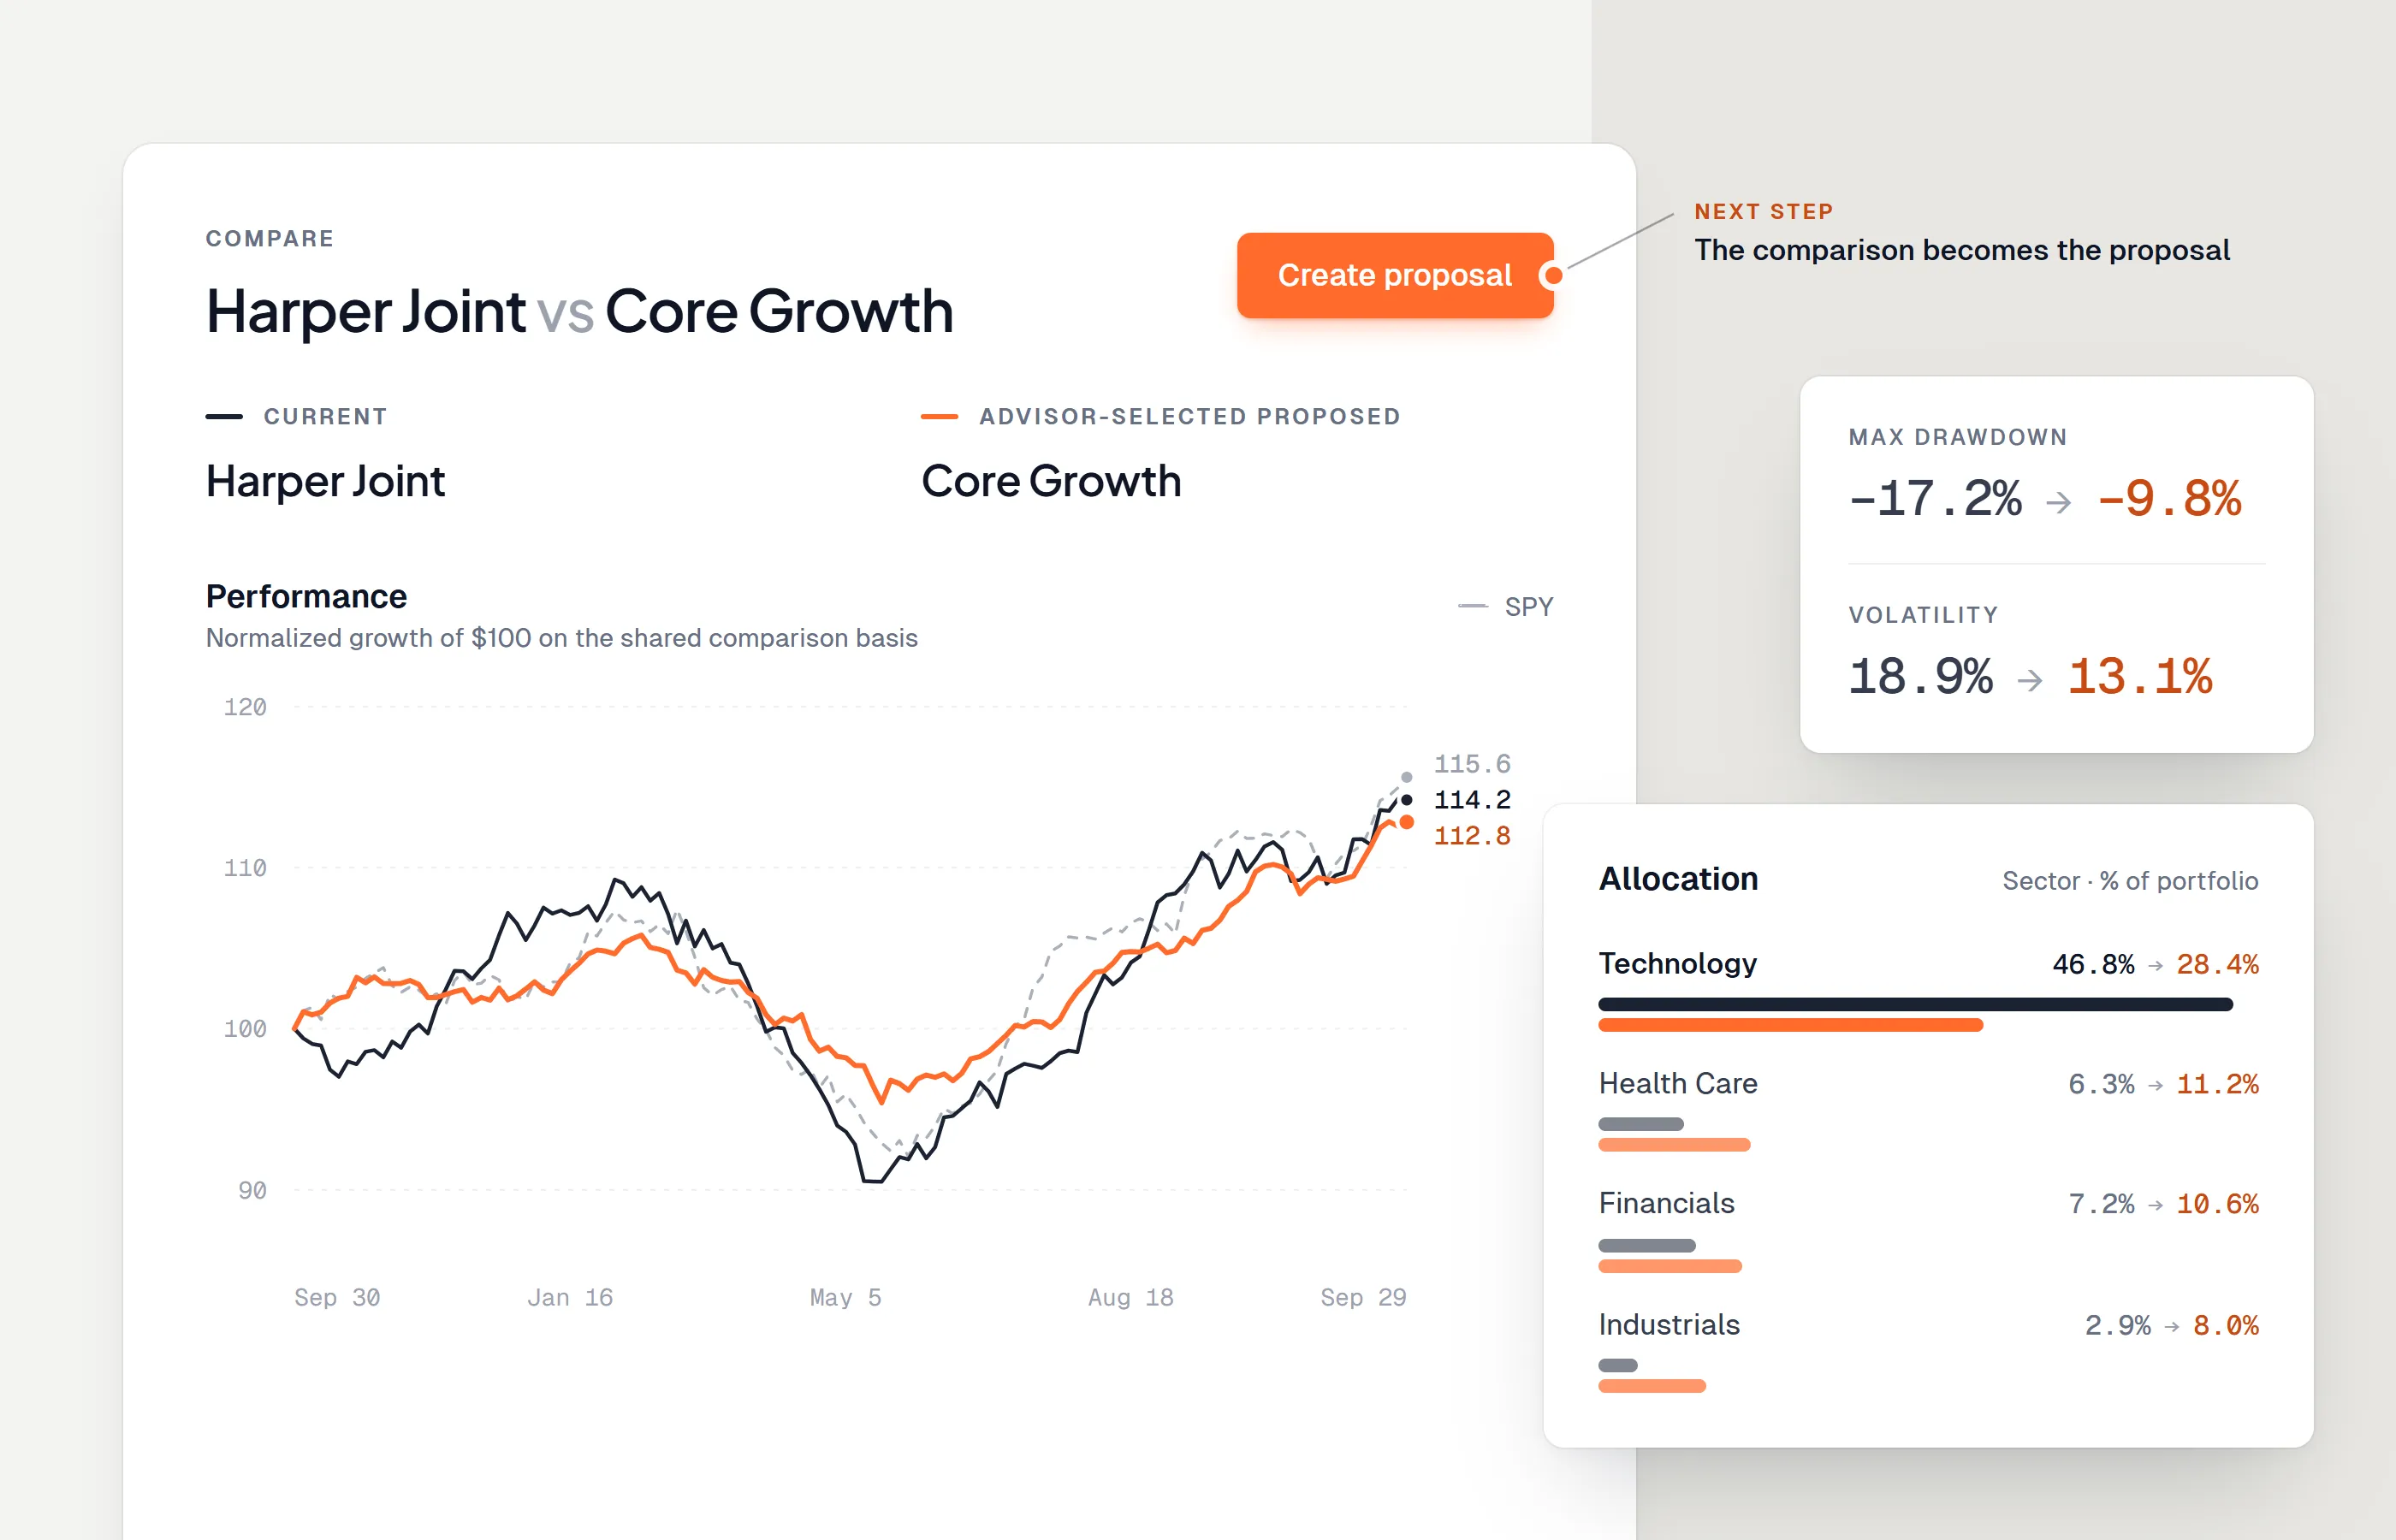
- P&L Attribution can identify whether returns came from genuine alpha or from incidental factor exposure — only visible when cross-asset context is available.
This is the operational difference between knowing your positions and understanding your portfolio.
How Genesis Risk Monitor Unifies Global Market Data
Genesis Risk Monitor consolidates streaming market data across all seven asset classes — equities, ETFs, forex, crypto, bonds, commodities, and equities options — into a single, cohesive analytical environment. The core data layer is entirely free:
Custom Watch Lists: Build personalised watch lists for any combination of global instruments — NYSE-listed equities, Eurozone bonds, EUR/USD and GBP/USD FX pairs, Bitcoin and Ethereum, NYMEX crude oil — tracked side-by-side in a single workspace.
Actionable Alerts: Set automated notifications for price moves, volume anomalies, or risk threshold breaches across any instrument in your watch list. Alerts fire immediately — no manual monitoring required.
Automated Risk Metrics: Genesis Risk Monitor calculates Value at Risk (VaR), CVaR, Factor Exposure, and P&L Attribution automatically, so quantitative risk intelligence is available without a quant team behind it.
Brokerage Integration: Pro plan users can connect live brokerage positions from 20+ brokerages — including Interactive Brokers, Fidelity, Charles Schwab, DEGIRO, and Alpaca — so risk calculations run against real holdings, not hypothetical models.
The platform is designed equally for investors operating from London, Paris, Frankfurt, New York, or anywhere else globally.
Conclusion
The 2026 financial landscape is too interconnected for siloed market data to be sufficient. Equity investors need FX context. Bond investors need commodity signals. Every investor needs to understand how their portfolio’s risk profile looks across asset classes simultaneously — not just within the one or two segments they trade most actively.
Building that cross-asset data foundation is the first step. Acting on it with structured, math-driven risk analytics is the second.
Genesis Risk Monitor gives you both — Market data across all seven asset classes, plus the automated analytics to make that data decision-ready — Try for free at genesis-rm.com.
Further Reading:
- How to Measure Investment Risk: VaR, CVaR, and Factor Exposure Explained
- Fixed Income Risk Analytics: A Guide for Bond Investors
- Connect Your Broker to Portfolio Risk Analytics
- 6 Essential Risk Analytics Tools for Investors in 2026
Regulatory & Compliance Disclaimer: Genesis Risk Monitor is strictly an analytics, software, and data visualization technology provider. We are not a broker, we do not offer regulated brokering services, and we are not registered with the Financial Conduct Authority (FCA) or the European Securities and Markets Authority (ESMA). Genesis Risk Monitor does not provide financial advice, investment recommendations, or solicitation to buy or sell any security. All final investment decisions remain solely with the user.
Frequently asked questions
What asset classes should every investor track for a complete view of global markets?
A complete global market view spans seven core asset classes: equities (individual company shares), ETFs (diversified baskets of securities), forex or FX (currency pairs reflecting global capital flows), crypto (digital assets including Bitcoin and Ethereum), bonds (government and corporate fixed income), commodities (energy, metals, and agricultural products), and equities options (derivatives used for hedging and yield generation). Tracking all seven allows investors to identify macro signals, manage cross-asset correlation risk, and make better-informed allocation decisions.
What is the difference between forex (FX) and crypto as market data sources?
Forex data reflects the exchange rates between established fiat currencies — USD, EUR, GBP, JPY — and is the most liquid market on Earth, with over $7 trillion traded daily. It signals global capital flows, central bank policy shifts, and macroeconomic divergence. Crypto data tracks digital assets like Bitcoin, Ethereum, and stablecoins on decentralised and centralised exchanges. Crypto markets operate 24/7, carry significantly higher volatility, and reflect sentiment in the emerging digital economy and DeFi sector. Both are valuable data inputs even for investors who do not actively trade either market.
Why does data fragmentation hurt portfolio performance?
When market data is spread across multiple disconnected dashboards — one for equities, another for FX, a third for crypto — investors miss cross-asset correlations and macro signals that only become visible when all data is viewed together. This fragmentation causes delayed reaction to risk events, incomplete picture of portfolio exposure, and wasted analytical time. Unified platforms like Genesis Risk Monitor consolidate streaming quotes, alerts, and automated risk metrics across all asset classes into a single environment, eliminating the gaps that fragmentation creates.
What is Value at Risk (VaR) and how does it apply to a multi-asset portfolio?
Value at Risk (VaR) is a statistical measure that estimates the maximum probable loss of a portfolio over a specified time horizon at a given confidence level — for example, a 1-day 95% VaR of €5,000 means there is a 5% chance of losing more than €5,000 in a single trading day under normal market conditions. In a multi-asset portfolio spanning equities, bonds, and commodities, VaR accounts for the correlation structure between holdings, giving a more accurate picture of aggregate risk than summing individual position risks in isolation.
How can European investors use global market data to manage Eurozone-specific risks?
European investors face macro risks that US-focused platforms often underweight: ECB policy decisions, EUR/USD and EUR/GBP currency exposure, Eurozone sovereign spread widening, and political risk within the EU. Monitoring FX pairs, European government bond yields, and commodities priced in euros alongside equity positions gives European investors the cross-asset context needed to anticipate how Eurozone-specific shocks will transmit across their portfolios. Genesis Risk Monitor provides this cross-asset data environment with no geographic restriction.
Is Genesis Risk Monitor free to use for market data and watch lists?
Yes. Genesis Risk Monitor offers comprehensive cross-asset market data — streaming quotes for equities, ETFs, forex, crypto, commodities, bonds, and equities options — along with personalised watch lists and price or risk threshold alerts, all at no cost. Advanced risk analytics such as daily VaR, CVaR, Factor Exposure, P&L Attribution, and brokerage account integration are available on the Pro plan at €25 per month. The free tier gives investors immediate access to global market data without any subscription requirement.