— 11 MIN
Portfolio Risk Analytics Best Practices for Independent Investors: 5-Step Framework
Discover 5 portfolio risk analytics best practices for independent investors: forward-looking VaR (parametric, historical, Monte Carlo), Barra-style factor exposure, historical and custom stress testing, dynamic covariance monitoring, and systematic risk limits with automated alerts.
For decades, professional-grade portfolio risk analytics were the exclusive domain of institutional trading desks, hedge funds, and family offices. Independent investors were left to manage risk reactively — often simply monitoring daily profits and losses (P&L) or calculating basic standard deviations on static spreadsheets.
But looking at P&L to manage risk is like driving a car while only watching the rearview mirror: it tells you where you have been, not what lies ahead. Modern markets are defined by high-correlation regimes, rapid factor rotations, and structural macroeconomic shifts. Under these conditions, traditional diversification — such as the classic 60/40 stock/bond split — can easily fail when assets that historically moved in opposite directions suddenly collapse in unison.
To protect capital and compound wealth predictably, self-directed investors must adopt a forward-looking, math-first approach. This guide breaks down five portfolio risk analytics best practices for independent investors and the framework to implement each one.
Key Takeaways
- Move from P&L to forward-looking Value at Risk (VaR) — calculate parametric, historical, and Monte Carlo VaR together, because each makes different tail-risk assumptions.
- Decompose risk into systematic factors — a Barra-style model reveals that diversification across fifteen technology stocks is a single growth/momentum bet, not a portfolio.
- Stress test for tail events — replay the 2008 GFC, 2020 COVID crash, and 2022 rate shock, then model custom macroeconomic scenarios before they happen.
- Monitor a dynamic correlation matrix — correlations are regime-dependent and converge toward 1.0 in crises; static spreadsheets will mislead you.
- Enforce systematic risk limits — maximum VaR, concentration caps, and drawdown triggers backed by automated alerts replace emotion with discipline.
1. Transition from Retrospective P&L to Forward-Looking Value at Risk (VaR)
Most brokerage dashboards display backward-looking performance metrics. Institutional risk managers instead rely on Value at Risk (VaR). VaR answers a vital, prospective question: what is the maximum amount I can expect to lose on this portfolio over a specific timeframe, at a given confidence level, under normal market conditions?
If a portfolio has a 1-day, 95% VaR of $5,000, there is a 5% chance (roughly one trading day per month) the portfolio loses more than $5,000 in a single session.
To implement this best practice, calculate VaR using three distinct methodologies — each making different structural assumptions:
Parametric (Variance-Covariance) VaR
Assumes asset returns are normally distributed, using the mean return , standard deviation , and the critical z-score for the chosen confidence interval (1.645 for 95% confidence):
Historical Simulation VaR
Avoids distributional assumptions by replaying the actual historical price changes of your current holdings over a set period (commonly the past 500 trading days). It ranks returns from worst to best and identifies the cut-off threshold at your chosen percentile.
Monte Carlo VaR
Uses stochastic processes (e.g., Geometric Brownian Motion) to simulate thousands of possible future price paths for your assets, accounting for their underlying volatilities and correlations.
Running all three together is the institutional standard. For more depth on each method, see our complete guide on how to measure investment risk with VaR, CVaR, and factor exposure.
2. Decompose Portfolio Risk into Systematic Factors
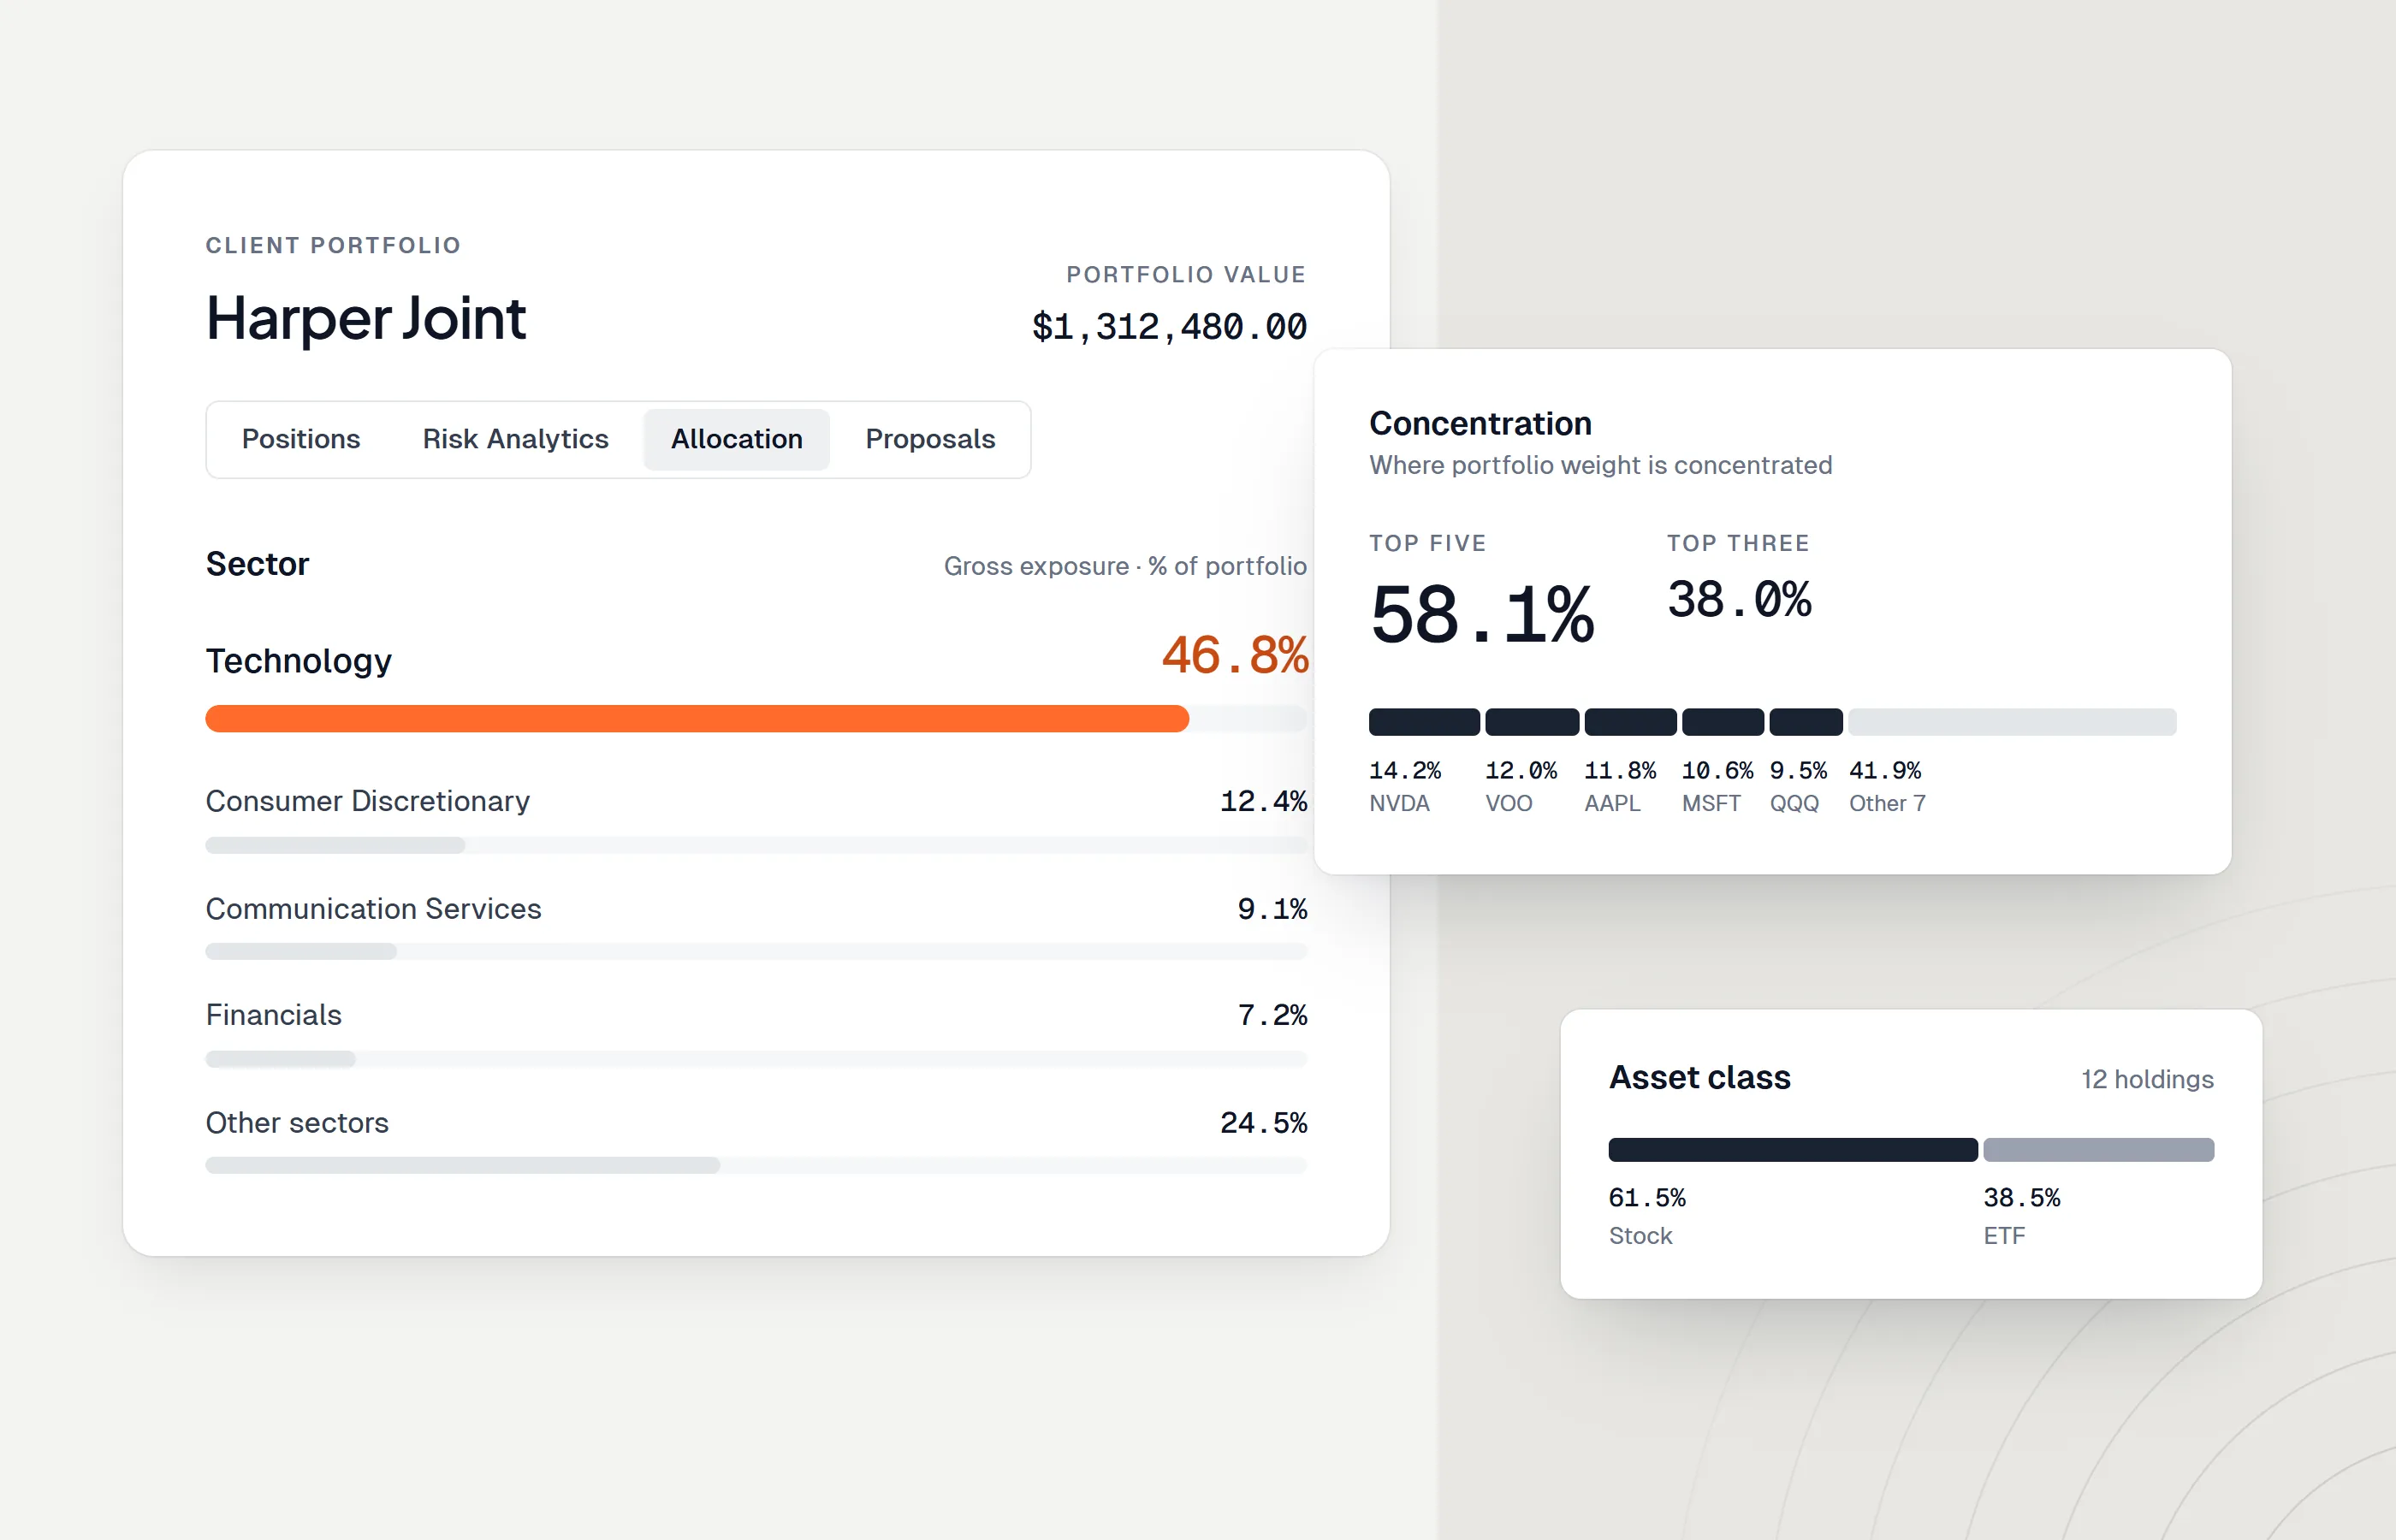
A portfolio that appears diversified across fifteen different technology stocks is not actually diversified; it is heavily exposed to a single systematic risk factor: the technology sector’s beta. To understand what actually drives your portfolio’s volatility, move beyond sector classifications and perform factor exposure analysis.
A multi-factor asset return model decomposes returns and variance into systematic drivers:
Where:
- is the return of asset .
- is the sensitivity (beta) of asset to factor .
- is the return of the systematic factor.
- is the idiosyncratic (asset-specific) residual risk.
Using a platform like Genesis Risk Monitor, independent investors can decompose holdings into Barra-style equity risk factors:
- Market Beta — sensitivity to the broad equity index.
- Size (SMB — Small Minus Big) — exposure to small-cap premium versus large-cap stability.
- Value/Growth (HML — High Minus Low) — sensitivity to fundamental valuation multiples (low Price-to-Book vs. high-growth expectations).
- Momentum (UMD — Up Minus Down) — exposure to trend-following capital flows.
- Low Volatility — sensitivity to defensive, low-beta characteristics.
If factor analysis reveals that your portfolio has an aggregate Value/Growth beta skewed heavily toward growth and a high positive exposure to momentum, your portfolio is highly vulnerable to growth-to-value rotations — regardless of how many different sectors your stocks represent. For full coverage of accessible Barra-style alternatives, see our affordable Barra risk metrics alternatives guide.
3. Stress-Test Portfolios Against Historical and Custom Scenarios
Standard risk metrics like volatility and VaR measure risk under normal market conditions. Long-term portfolio survival, however, is determined by performance during abnormal conditions — the tail-risk events.
Stress testing and scenario analysis simulate how your current portfolio would react to severe macroeconomic shocks. Independent investors should run two types of stress tests:
Historical Regimes
Replay historical crises to see exactly what your current asset allocation would have lost. Key scenarios to model:
- 2008 Global Financial Crisis — high volatility, extreme equity drawdowns, and credit spread widening.
- 2020 COVID-19 Sell-off — sudden, massive liquidity evaporation and rapid equity repricing.
- 2022 Interest Rate Shock — rapid monetary tightening causing simultaneous equity and fixed-income sell-offs.
Custom Macroeconomic Shocks
Rather than waiting for history to repeat, model hypothetical shifts using current macroeconomic indicators. For example, what happens to your equity-heavy portfolio if inflation (CPI) spikes by another 150 basis points, or if the U.S. treasury yield curve steepens rapidly?
Genesis Risk Monitor allows you to analyse these scenarios and set up your own assumptions to test your portfolio against custom yield-curve shifts and monetary policy shocks before they occur. For a deeper treatment, read our complete guide on how to stress test your portfolio and our primer on what scenario analysis is in finance.
4. Monitor Cross-Asset Correlations via a Dynamic Covariance Matrix
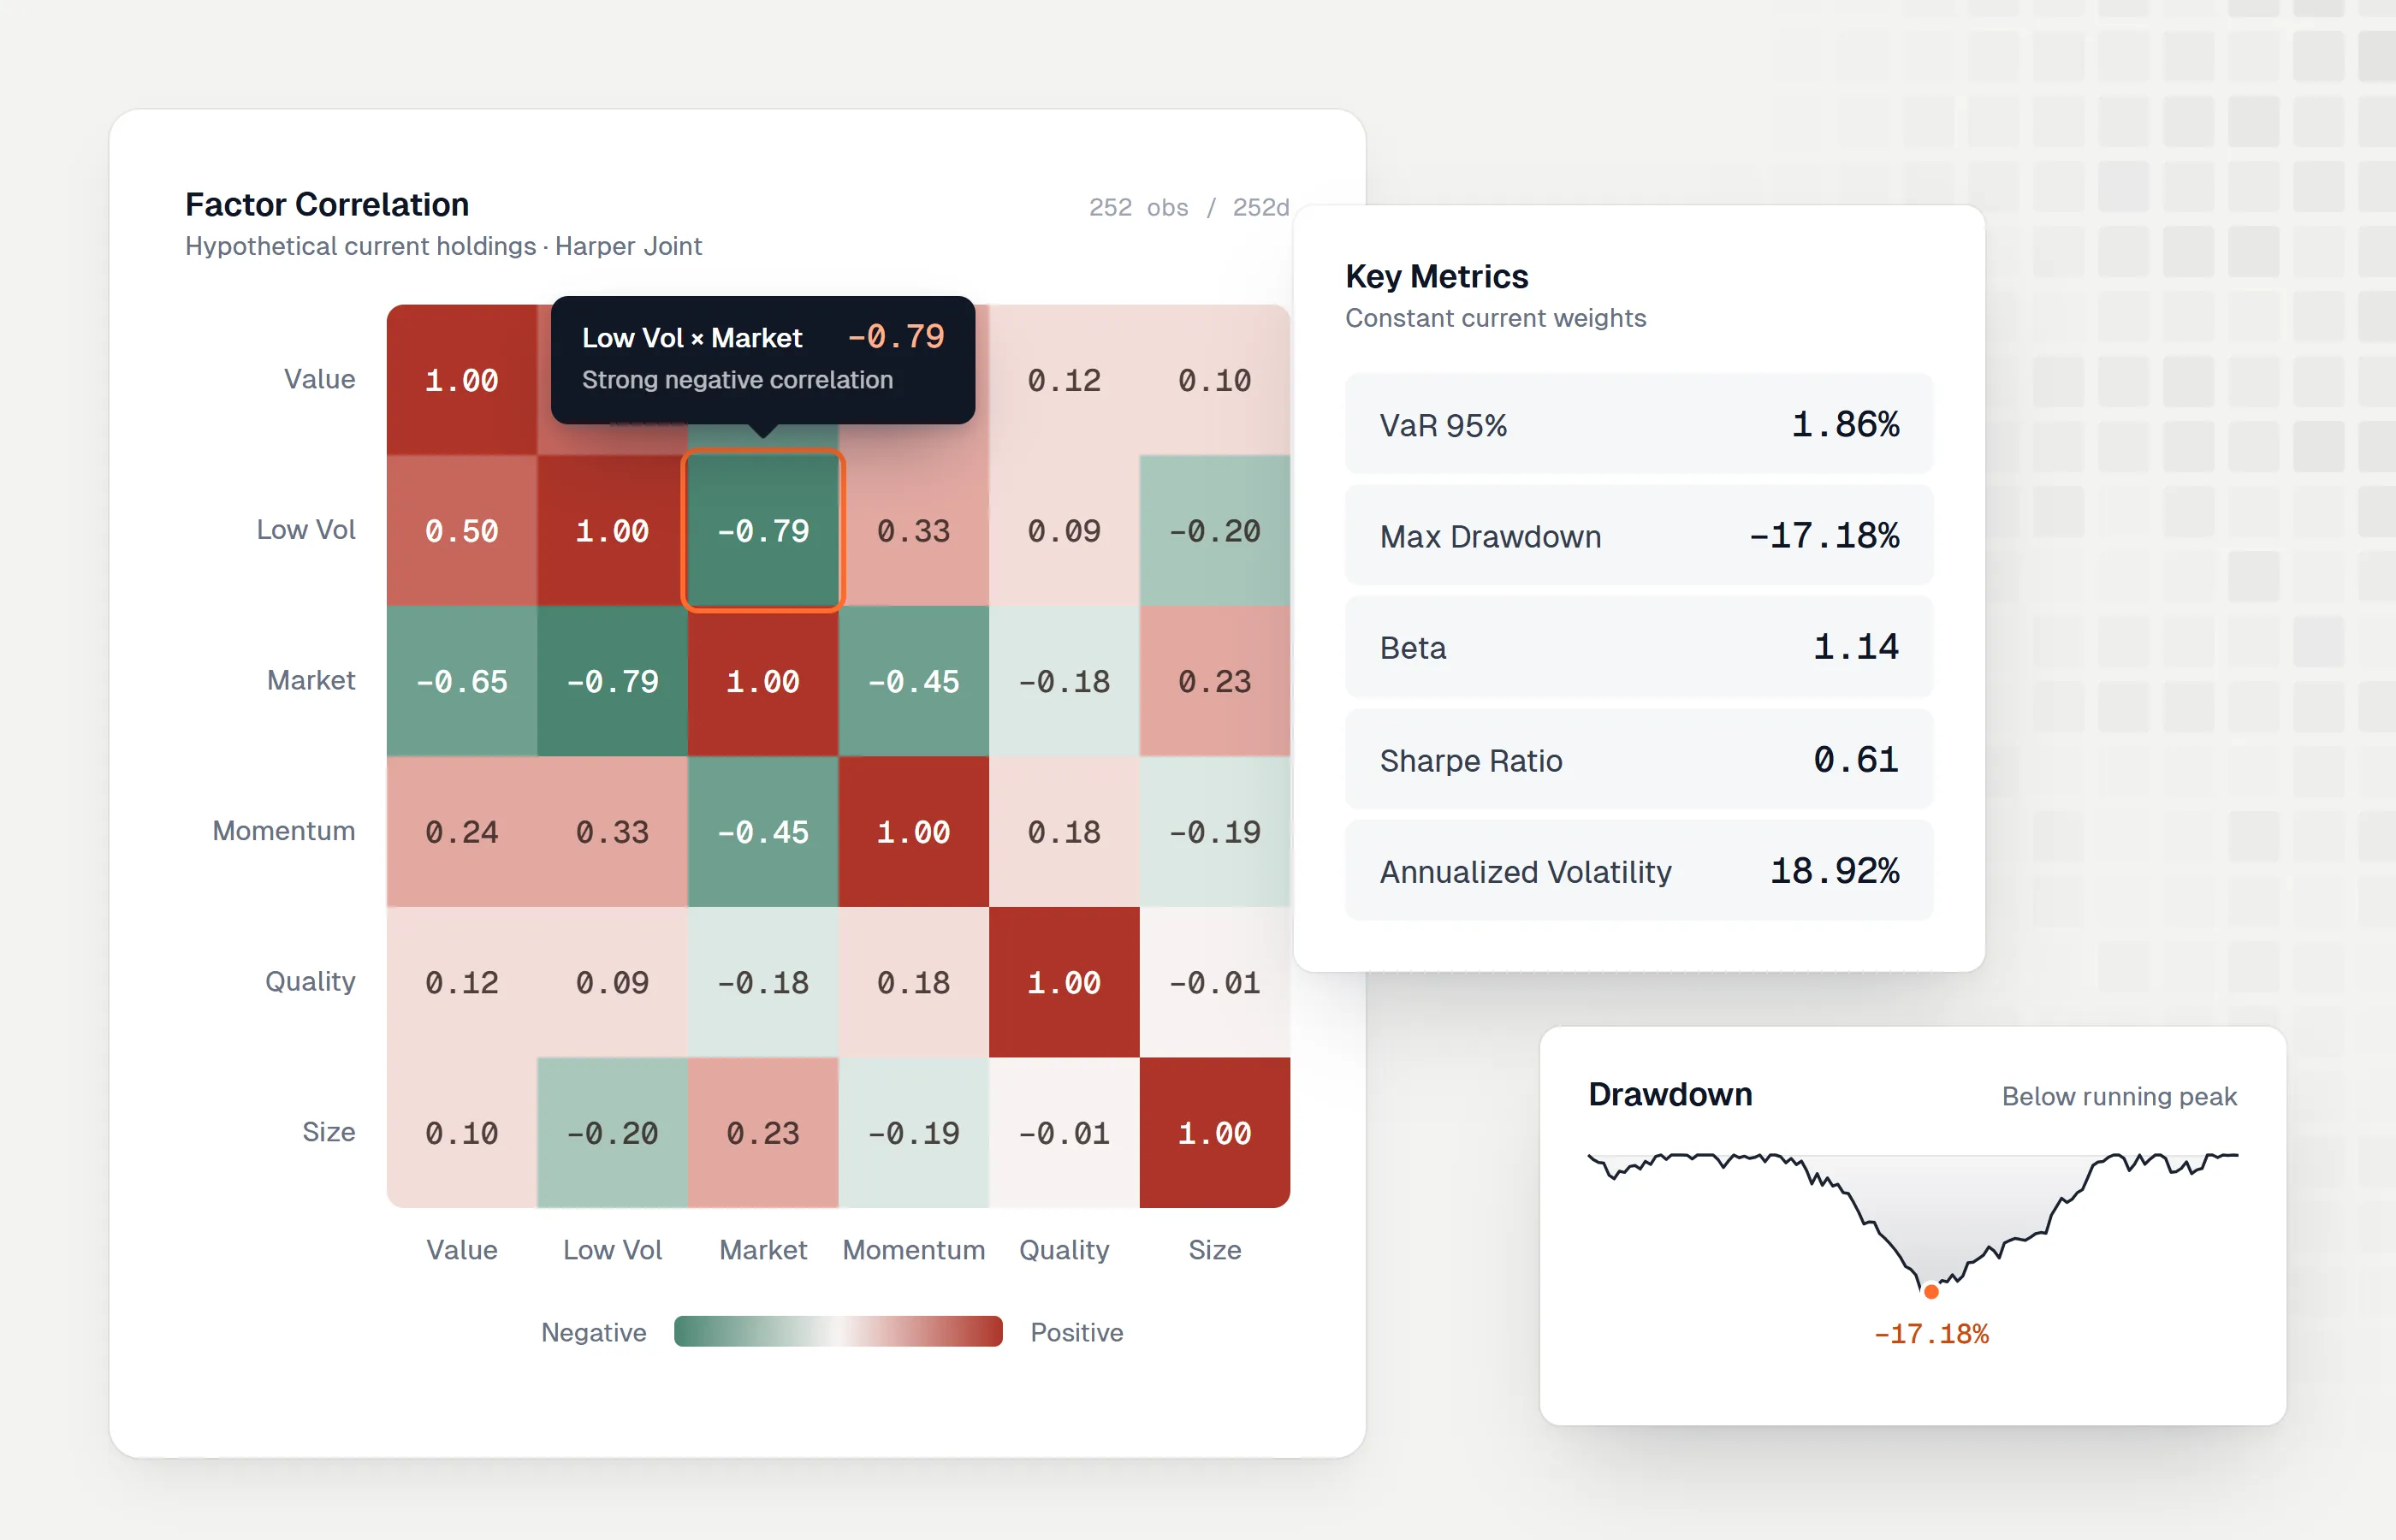
One of the most dangerous fallacies in retail portfolio management is treating correlation as a static number. In reality, correlations are highly dynamic and regime-dependent. Under normal, bullish conditions, assets may move independently, providing true diversification. During systemic liquidity crises, asset correlations tend to converge toward 1.0.
The correlation coefficient between asset and asset is defined as:
where is the covariance of the two assets and represents their respective standard deviations.
If you rely on static spreadsheets, you are likely calculating correlation using outdated historical data. A best-practice workflow requires monitoring a live, dynamic correlation matrix.
Why Dynamic Correlation Monitoring is Essential
- Spotting hidden duplication: if two ETFs in your portfolio have a correlation coefficient of , they carry essentially the same risk profile. Holding both increases transaction costs without meaningful diversification.
- Tracking regime shifts: if the correlation between your equity holdings and your hedging instruments (long-dated Treasuries, gold) shifts from negative to positive, your hedges will fail precisely when needed. Real-time monitoring lets you adjust hedges proactively.
For the full practitioner’s guide — including how to read a correlation heatmap and how correlation behaves during crises — see our correlation and covariance matrix guide.
5. Establish Systematic Risk Limits & Automated Alerts
The final and most crucial best practice is translating analytics into discipline. Sophisticated math on a screen is useless if human emotions dictate trades during market panic.
Institutional desks use strict Investment Policy Statements (IPS) and risk-limit protocols. Independent investors should mirror this discipline by establishing systematic limits on key risk metrics:
- Maximum Portfolio VaR — an absolute threshold, e.g., your 1-day, 95% VaR must never exceed 2.5% of total Net Asset Value.
- Concentration Limits — a hard ceiling on individual position weights, e.g., no single stock above 10% of the portfolio and no single industry above 20%.
- Drawdown Triggers — predetermined intervention levels. If your drawdown breaches a defined percentage, you systematically scale back leverage or transition a percentage of assets to cash.
Instead of recalculating and checking these metrics manually every day, leverage automated real-time alerts with Genesis Risk Monitor. Automated limits ensure that if a sudden volatility spike pushes your portfolio’s VaR past your risk tolerance, you are alerted instantly to de-risk before catastrophic losses occur.
Transitioning from Spreadsheets to Professional Platforms
Historically, implementing these five best practices was incredibly difficult for independent investors. It required building fragile Excel templates, manually importing daily closing prices, and fighting with complicated mathematical models.
Today, platforms like Genesis Risk Monitor bridge this gap entirely. By integrating directly with over 20+ major brokerage accounts — including Interactive Brokers, Fidelity, Charles Schwab, and Questrade — via secure, read-only connections, the platform automates the heavy lifting.
| Feature / Capability | Fragmented Spreadsheets | Standard Broker Dashboards | Genesis Risk Monitor |
|---|---|---|---|
| Position Updates | Manual entry (prone to errors) | Automated | Automated (20+ broker integrations) |
| Value at Risk (VaR) | Complex formulas, static data | Non-existent | Yes (Historical, Parametric, Monte Carlo) |
| Factor Exposure | Difficult for average users | Sector-only classifications | Yes (Barra-style systematic factors) |
| Stress Testing | Manual, historical estimation | Non-existent | Yes (Historical crises & custom shocks) |
| Macro Context | Static copy-paste data | Basic news feeds | Yes (direct FRED macro integrations) |
| Risk Limit Monitoring | Manual tracking | Basic price-level alerts | Yes (alerts for VaR, position weight, drawdown…) |
Summary: Build a Math-First Workflow
Managing a portfolio successfully across market cycles requires treating risk as a measurable, manageable metric rather than an abstract feeling. By moving beyond backward-looking P&L, decomposing systematic factors, stress testing for tail events, tracking dynamic correlations, and enforcing systematic risk limits, you put math on your side.
Your eyes should not be your primary risk-monitoring system. Let Genesis Risk Monitor handle the complex mathematical calculations and systematic tracking, so you can execute your investing strategy with mechanical discipline.
Ready to institutionalize your personal portfolio management? Connect your brokerage securely to Genesis Risk Monitor and receive an instant, multi-method risk analysis of your holdings today.
Frequently Asked Questions (FAQ)
What is the main difference between standard deviation and Value at Risk (VaR)? While standard deviation measures the general historical dispersion or “bounce” of your portfolio’s returns (volatility), Value at Risk (VaR) is a forward-looking downside estimation. VaR translates volatility into a concrete monetary figure, telling you the maximum amount you are likely to lose at a specific confidence level over a given time horizon under normal market conditions.
How often should I calculate or review these risk metrics? Ideally, risk metrics should be calculated on a daily basis. While your overall strategy might only change quarterly, market volatilities, correlations, and macroeconomic conditions change every second. Manual calculation makes daily updates impossible, but automated tools like Genesis Risk Monitor sync with your brokerage daily to update your VaR, correlations, and factor exposures automatically.
I only invest in simple, broad-market index funds. Do I still need multi-factor risk analysis? Yes. Many investors assume broad index funds are perfectly diversified. However, because most major market-cap-weighted indices are heavily concentrated in mega-cap technology and growth stocks, a “simple” index portfolio might carry an unintended, heavy concentration in the growth and momentum factors. Decomposing these funds helps you understand your true underlying factor exposures.
Can historical stress tests accurately predict future losses? Historical stress tests replay actual crises (like the 2008 Financial Crisis or the 2020 COVID sell-off) to show how your current asset mix would have behaved. While future crises will never look exactly like the past, historical stress tests give you a realistic “worst-case” boundary. To supplement this, you should also run hypothetical custom macro stress tests based on shift-scenarios in inflation and interest rates.
Further Reading
- How to Measure Investment Risk: VaR, CVaR, and Factor Exposure Explained
- How to Stress Test Your Portfolio
- Understanding Correlation and Covariance: A Practical Guide for Modern Investors
- Affordable Barra Risk Metrics Alternatives
- Portfolio Risk Analytics Platform: VaR, Factor Exposure, and Stress Testing Compared
- 6 Essential Risk Analytics Tools for Investors in 2026
Disclaimer: The content of this article is for informational and educational purposes only and does not constitute financial advice, investment recommendations, or an endorsement of any specific strategy, security, or platform. Trading and investing involve substantial risk of loss. Platform pricing and feature sets are subject to change — verify current details directly with each provider before making purchasing decisions. Please consult a qualified financial advisor before making any investment decisions.